Figure 7.

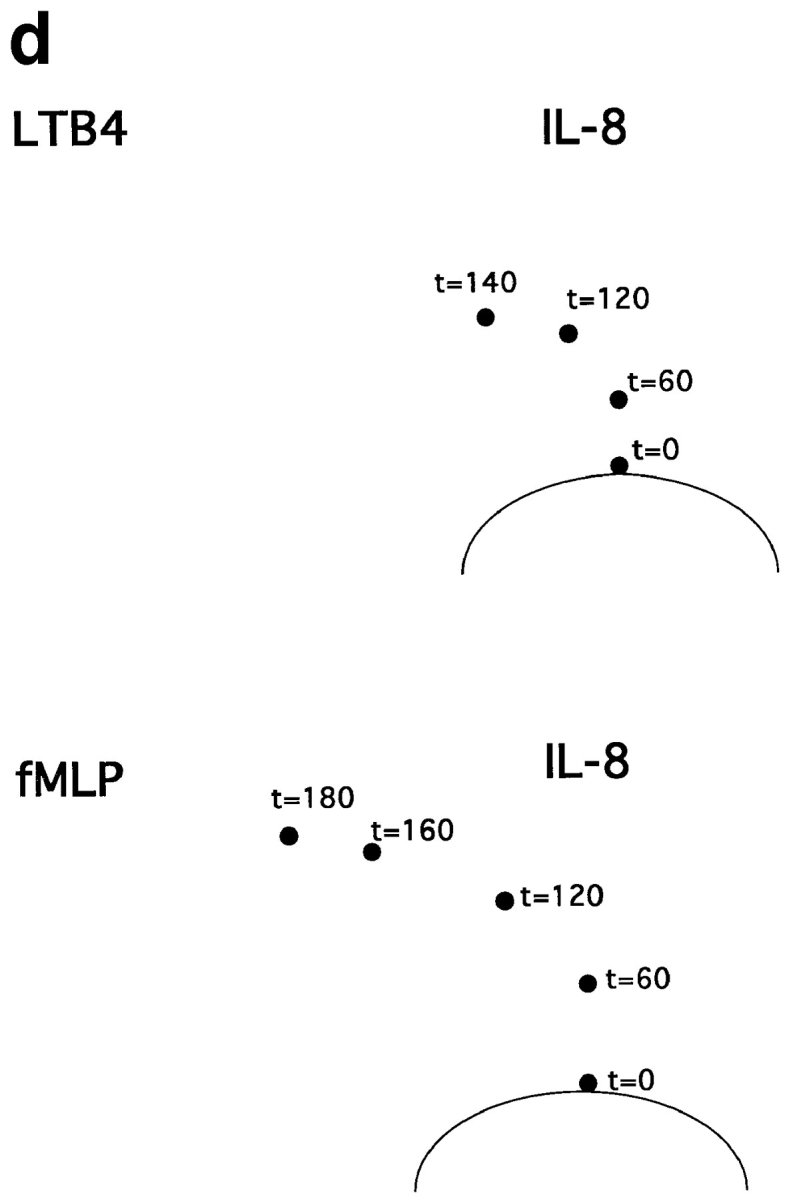
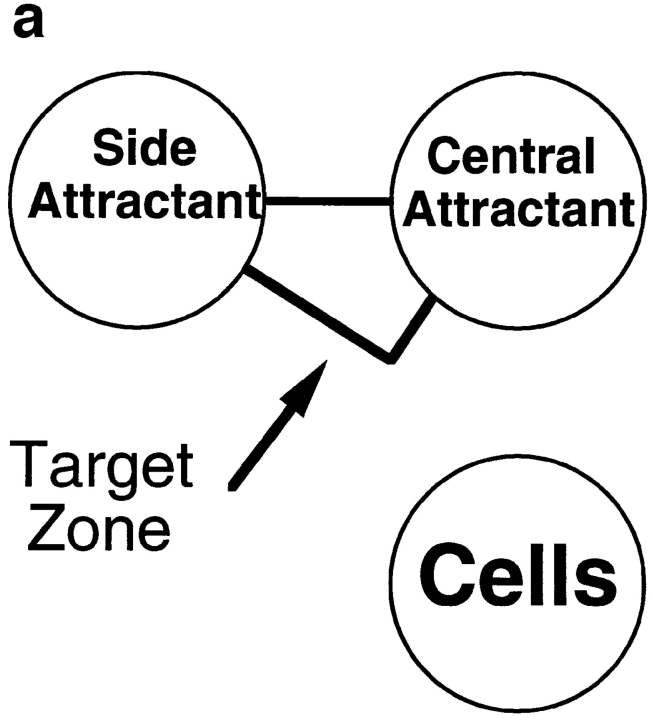
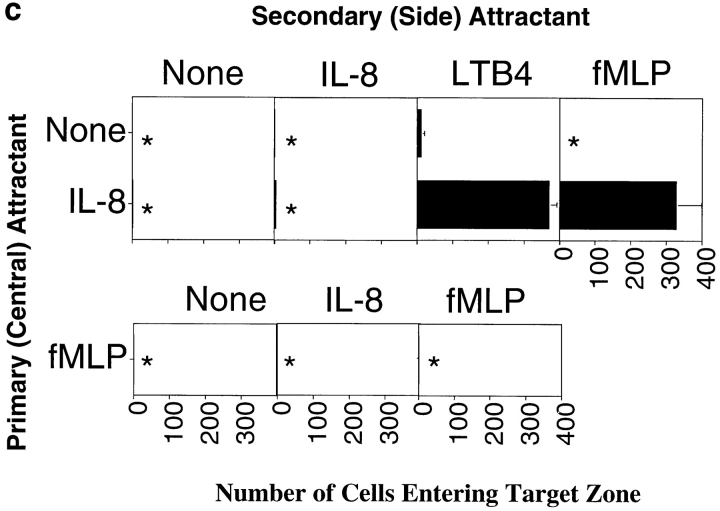
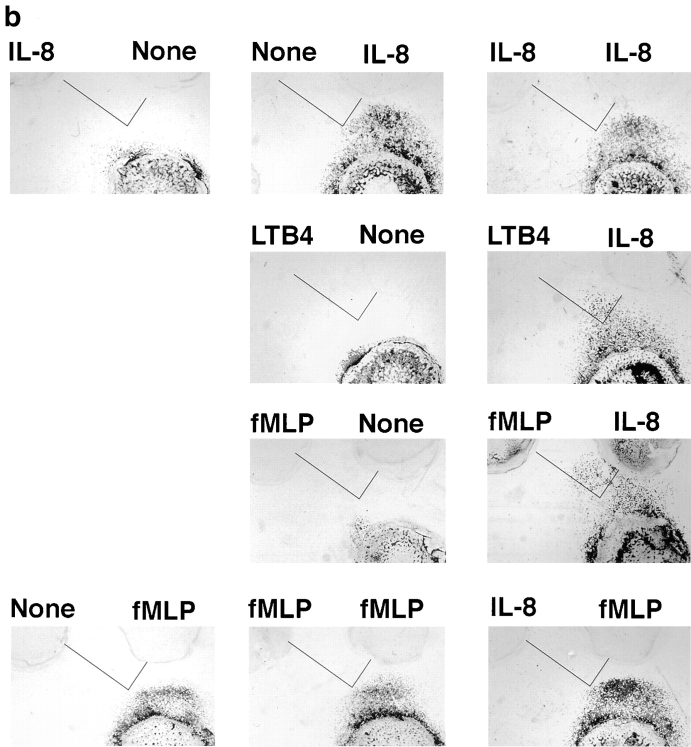
Neutrophil navigation targeted by sequential migration to chemoattractants in a defined spatial array. (a) Diagram illustrating the position of the two agonist wells relative to the cell well, and the outline of the target zone used to quantitate the number of cells migrating sequentially to both agonists (see c). (b) Photographs of fixed, stained cells that have been allowed to migrate for 3 h in the presence or absence of a central agonist (right side of photos) and/or side agonist (left side of photos). The approximate position of the target zone is indicated in each image (for quantitative analyses, target zones were precisely positioned by a template). Successfully homed cells have been accentuated for illustrative purposes by enhancing the contrast in the target region. The amounts of IL-8, LTB4, and fMLP in the agonist wells were 1 pmol, 1 pmol, and 0.5 pmol, respectively. (c) Graph indicating the number of cells migrating into the defined target zone in presence of various agonist combinations. The mean number of cells entering the target zone is indicated. Error bars show the range for two replicate determinations from a representative experiment. Asterisks indicate that the mean number of cells in the target region was <15. (d) Turning behavior of cells migrating to two agonists in sequence. Dots indicate the center of the leading edge of migrating cells at various times for cells responding to a central IL-8 source and side LTB4 source (top) or a central IL-8 source and side fMLP source (bottom).


