
Figure 4.


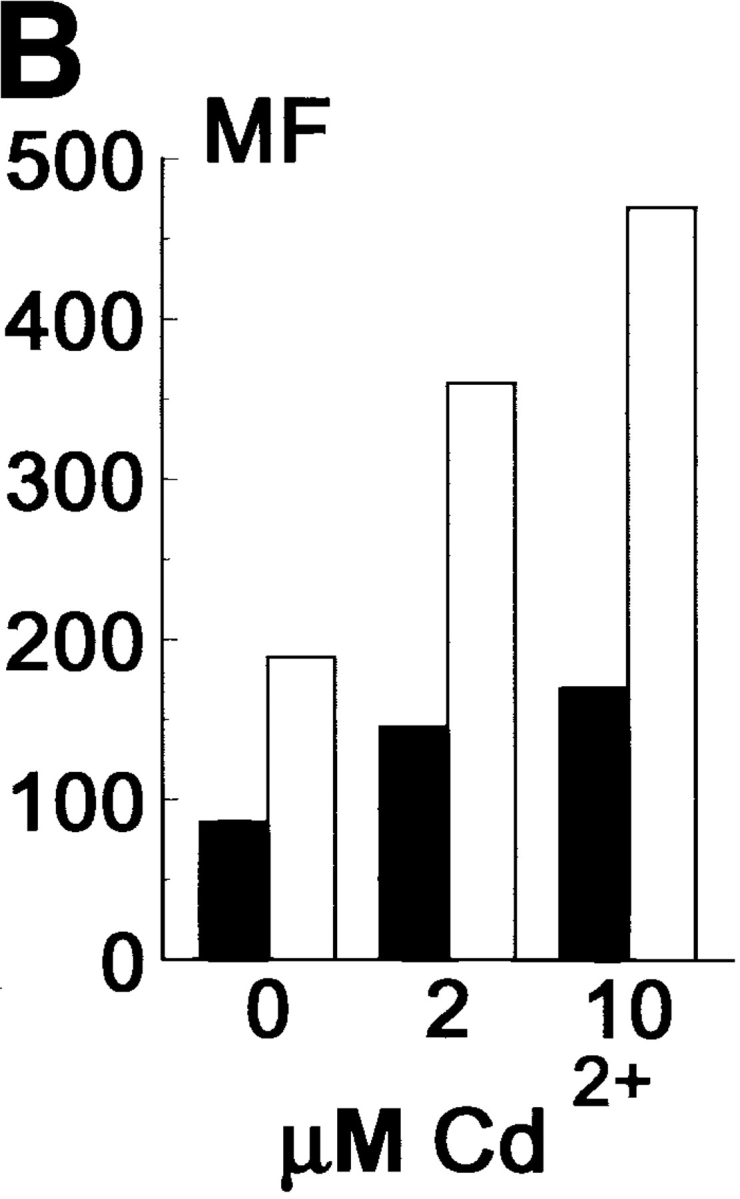

Effect of increasing expression of Ep-CAM on cell–cell interactions in L cell E-cadherin transfectants (LEC). LEC cells were supertransfected with Ep-CAM cDNA under the control of the metallothionein promotor (clones LEC-MEp.2 and LEC-MEp.6), or with blank vector (LEC-MC). Induction of Ep-CAM expression with CdCl2 for 24 h resulted in an increased total Ep-CAM (A, immunoblot of total cell lysates) and in an increased presence of Ep-CAM molecules at the cell surface (B, flow cytometry with anti–Ep-CAM F(ab)-FLUOS conjugate). Cells detached with TC treatment were allowed to aggregate in suspension for 30 min in the presence of Ca2+, and the degree of cell aggregation was determined (C). The statistical significance of the observed differences in aggregation rates was determined using the Student's t-test (p). Where indicated, cells were cultured for 24 h before the assay in the presence of CdCl2 in culture medium. (D) The morphology of aggregates formed in 30 min by LEC-MC and LEC-MEp.6 cells (the latter noninduced and induced with 10 μM CdCl2).