
Figure 10.
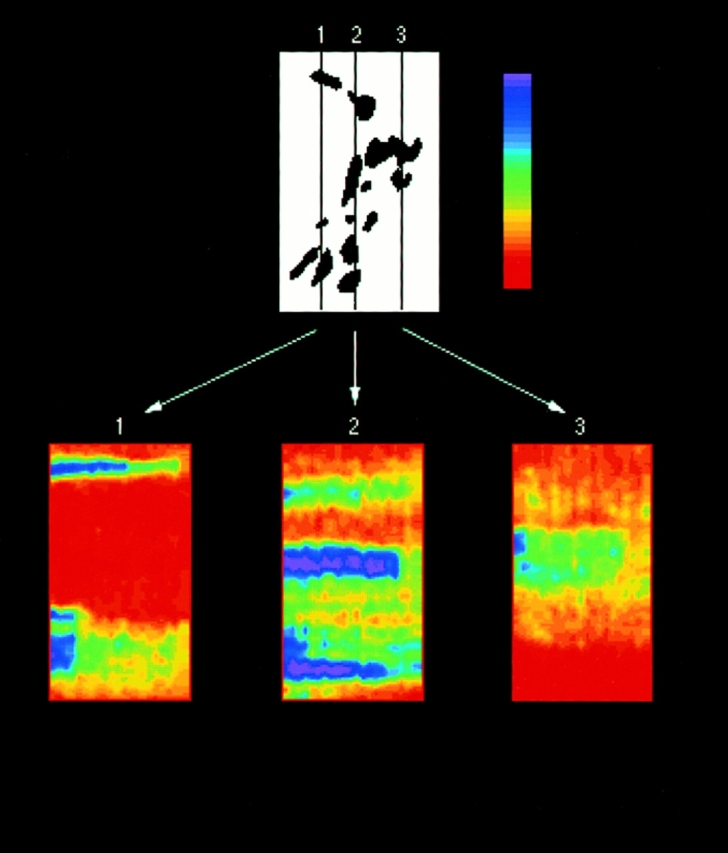
Separate BODIPY-ceramide–labeled Golgi elements in the same cell disassemble at different times during BFA treatment. BFA-induced redistribution of Golgi membranes labeled with BODIPY-ceramide were visualized in individual cells using a cooled CCD microscope system. The images were digitized and analyzed on a computer. The entire image set of 22 images (each image 9-s apart) was used to construct three time series (bottom panels 1, 2, and 3) correlating to three vertical line scans through the data set. The distribution of Golgi elements at the start of the experiment is shown in the top panel. The three vertical lines (1, 2, and 3) in this panel show the position of the vertical line scans used to construct the time series shown in color below it. The direction of time in the vertical line series is left to right from 2:40 to 6:09 min. The intensity of the BODIPY-ceramide label was mapped to a color lookup table (upper right) with highest intensities labeled purple and lowest intensities orange. From these images it is evident that distinct BODIPY-ceramide–containing elements (purple) disassemble abruptly and with unique kinetics in cells treated with BFA.