Figure 8.
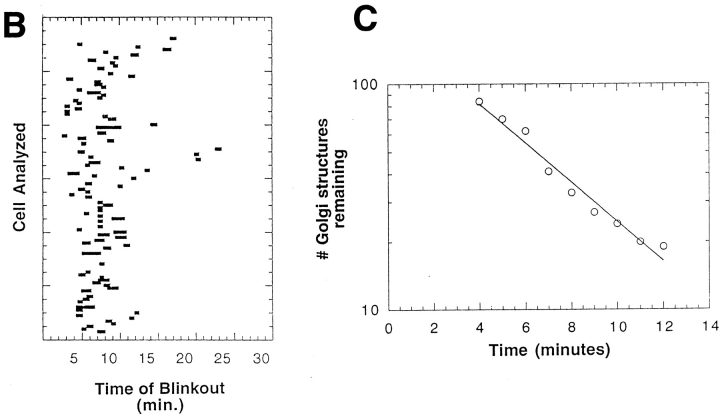
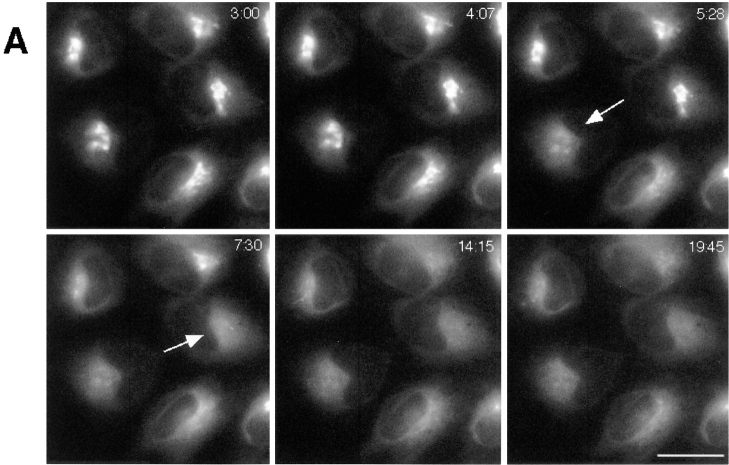
Kinetics of disassembly of BODIPY-ceramide–labeled Golgi structures in BFA-treated cells. Cells were labeled with BODIPY-ceramide and treated with BFA. They were then imaged at 37°C using a cooled CCD microscope system. (A) Image sequences of a field of cells from 3 min (3:00) to 19 min 45 s (19:45) of BFA treatment showing redistribution of BODIPY-ceramide from juxtanuclear Golgi structures into the ER. Arrows point to cells that have just undergone blink out. (B) Time-lapse sequences were taken as described above with images collected at 13.5-s intervals. Bars show duration (start to finish) of Golgi blinkout for 110 cells. Start of blinkout was the first frame showing spreading of fluorescence. The end was the last frame to show change. Onset and duration of Golgi blinkout in BODIPY-ceramide– labeled Golgi membranes was indistinguishable from GFP-GalTase–labeled Golgi membranes. (C) The data set in B was replotted to show the number of Golgi structures remaining as a function of time in BFA. The best fit exponential function to the numbers is the line shown on the graph, indicating that the kinetics of Golgi blinkout in a cell population is a first order process. Bar, 10 μm.


