
Figure 8.
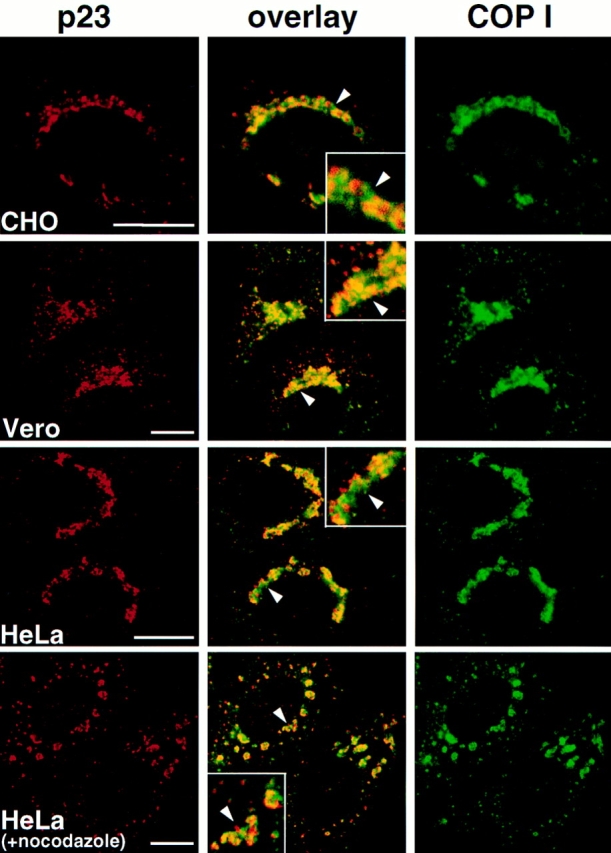
COP I and p23 distribution. The indicated cell types were fixed and processed for immunofluorescence, or treated with 10 μM nocodazole for 2 h before fixation (+ nocodazole). Images were processed and merged (overlay) as in Fig. 3. The inset shows a higher magnification of the area indicated by an arrowhead. Whereas both COP I and p23 localized to the perinuclear Golgi region in all cell types, the distribution of the two proteins was clearly different even in the absence of nocodazole. It is not clear to what extent overlapping signal (yellow) is due to colocalization of the proteins or to superimposition of two close but separated fluorescent signals. Bar, 5 μm.