
Figure 6.
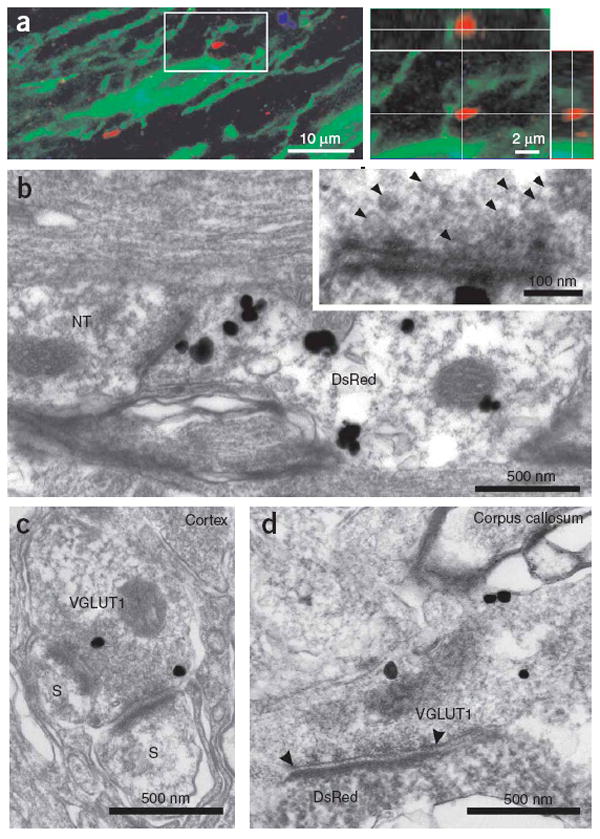
Axons form defined synaptic junctions with NG2+ cells within the corpus callosum. (a) Triple-immunofluorescence of NG2 (green), VGLUT1 (red) and Map2 (blue) immunoreactivity in a projection image showing close association between VGLUT1+ puncta and NG2+ processes; these VGLUT1+ puncta were not in close proximity to neuronal dendrites (blue process, left image). The area circumscribed by the white box is shown in an orthogonal reconstruction with x-z and y-z planes extracted at the levels indicated by the white lines (right). (b) Thin-section electron micrograph from the corpus callosum. Silver-enhanced pre-embedding immunogold for DsRed shows an NG2+ cell process (DsRed) opposed to a nerve terminal (NT) containing small clear vesicles. The inset shows the active zone region at higher magnification, illustrating the region of close apposition between axon and NG2+ cell membranes, the accumulation of electron-dense material, and the presence of small (∼35-nm-diameter) vesicles in the axon. (c) Thin-section electron micrograph from the cortex showing VGLUT1 immunoreactivity (silver-enhanced immunogold, VGLUT1) in a terminal bouton that forms two synapses with dendritic spines (S). (d) Thin-section electron micrograph from the corpus callosum showing VGLUT1 immunoreactivity (silver-enhanced immunogold, VGLUT1) in an axon that forms a synaptic junction (highlighted by arrowheads) with a lightly labeled NG2+ cell process (DsRed immunoreactivity, horseradish peroxidase product).