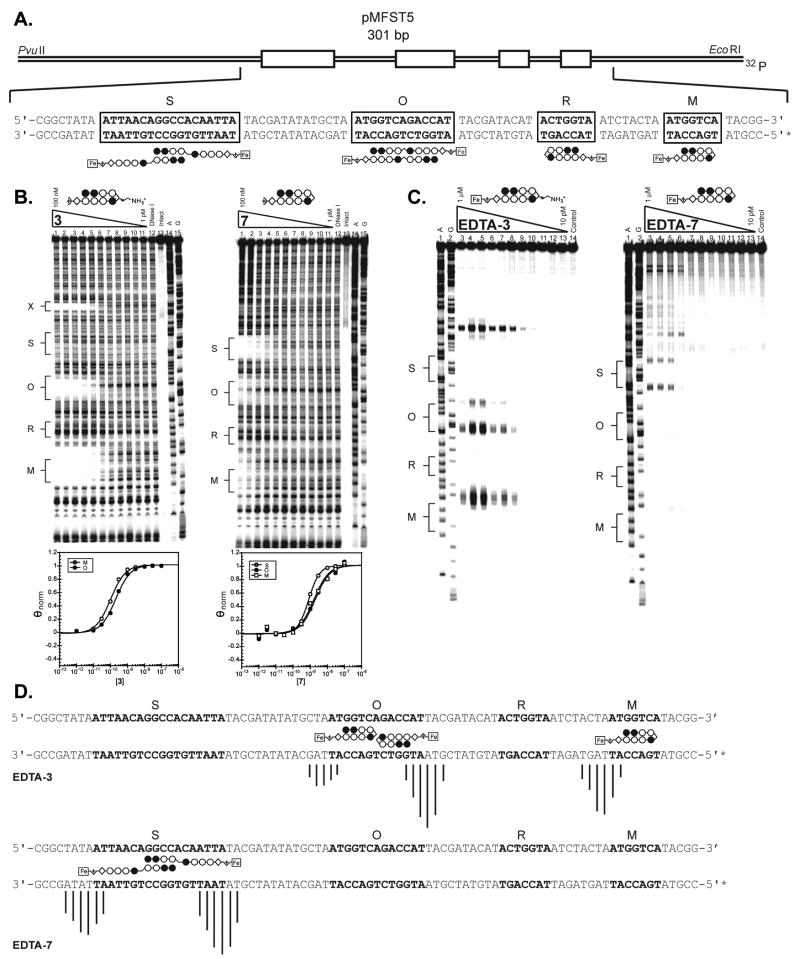
Figure 7.
(A) Illustration of the EcoRI/PvuII restriction fragment derived from plasmid pMFST5. The designed polyamide binding sites are indicated by boxes. Binding models are illustrated below the DNA sequence by ball-and-stick structures of EDTA-7. (B) Quantitative DNase I footprinting titration experiments for polyamides (left) 3 and (right) 7 on the 301 base pair, 5′ end-labeled PCR product of plasmid pMFST5: lanes 1–11, 100 nM, 30 nM, 10 nM, 3 nM, 1 nM, 300 pM, 100 pM, 30 pM, 10 pM, 3 pM, and 1 pM polyamide, respectively; lane 12, DNase I standard; lane 13, intact DNA; lane 14, A reaction; lane 15, G reaction. Site X indicates an undesigned match site inherent in the plasmid sequence. (Below) Each footprinting gel is accompanied by its respective binding isotherms. (C) Affinity cleavage experiments with polyamide-EDTA conjugates (left) EDTA-3 and (right) EDTA-7 on the 301 base pair, 5′ end-labeled PCR product of plasmid pMFST5: lane 1, A reaction; lane 2, G reaction; lanes 3–13, 1 μM, 300 nM, 100 nM, 30 nM, 10 nM, 3 nM, 1 nM, 300 pM, 100 pM, 30 pM, and 10 pM polyamide, respectively; lane 14, intact DNA. (D) Summary of affinity cleavage patterns for (top) EDTA-3 and (bottom) EDTA-7. Bar heights are proportional to the relative cleavage intensities at each base pair, normalized to each gel. Ball-and-stick structures illustrating their respective proposed modes of binding are shown using EDTA-7 for clarity. Designed binding sites are indicated in bold in the DNA sequence.

