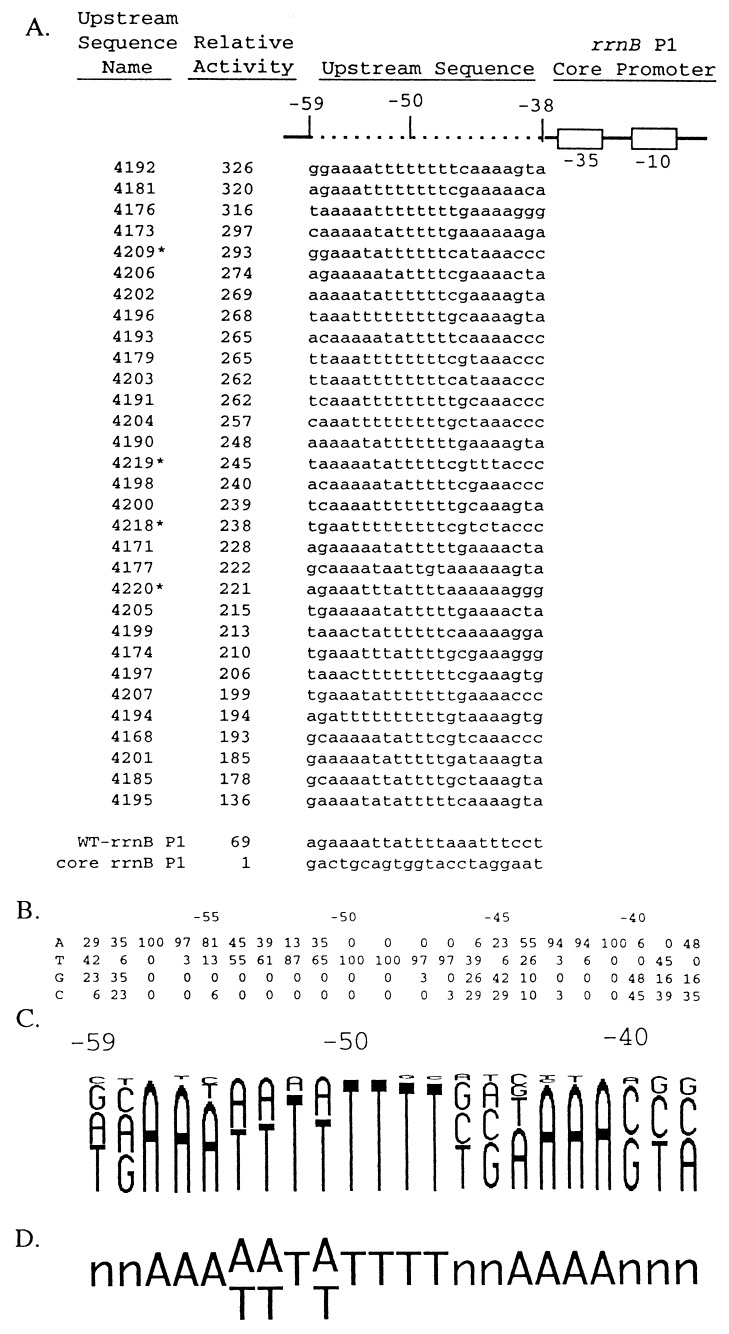
Figure 2.
Upstream sequences and relative transcription activities of 31 in vitro-selected promoters used in defining an UP element consensus sequence. (A) Promoters contained wild-type rrnB P1 sequences (solid line; open boxes indicate the −10 and −35 hexamers) and different upstream regions (dotted line). Sequences of the nontemplate strand in the upstream region (−59 to −38) from 31 selected promoters, wild-type rrnB P1, and the rrnB P1 core promoter are shown. Wild-type rrnB P1 contained its natural UP element sequence, and the core rrnB P1 promoter contained an upstream sequence with no UP element function [the SUB sequence with A residues at positions −39 and −40 (6)]. Upstream sequence names are the strain numbers of λ lysogens carrying the promoter–lacZ fusions. Asterisks indicate promoters with single base-pair mutations (probably introduced during PCR amplification) downstream of the transcription start site (between +2 and +17). Sequence variation in this region of rrnB P1 does not affect promoter activity (35). Promoter activities are expressed relative to the activity of the core rrnB P1 promoter (activity = 1; strain RLG3097) and were determined from β-gal measurements in λ lysogens containing promoter–lacZ fusions. Relative activities differed by less than 10% in at least two different experiments. (B) Nucleotide frequencies (percentage of 31 sequences) at each position, −59 to −38, in the set of selected sequences shown in A. (C) Frequency diagram of the data in B. Each nucleotide is represented as a letter proportional in size to its frequency at that position in the selected population. (D) Consensus UP element sequence. One nucleotide is indicated when it is present in more than 55% of the population and two when together they represent more than 95% of the population.

