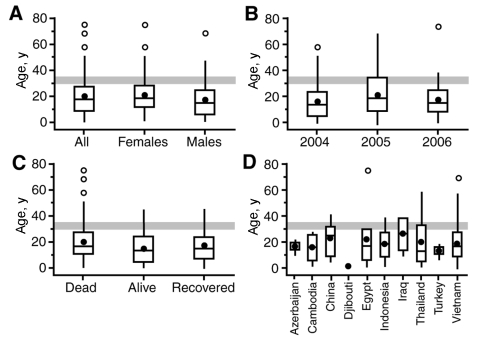
Figure.
Age distribution of patients with confirmed cases of avian influenza (H5N1), December 2003–May 2006 (4,5). Box-and-whisker plots show the age distribution of patients by A) sex; B) year of report, C) patient outcome, and D) country. The horizontal line and bullet mark in each box give the median and mean age of cases, respectively. Variability in age is shown by plotting the first and third quartiles (Q1 and Q3) of the ages as the outer limits of the shaded box. Whiskers encompass all ages that satisfy the criteria Q1 – 1.5(Q3 – Q1) (lower limit) and Q3 + 1.5(Q3 – Q1) (upper limit). Points beyond the whiskers denote outliers. Panel C data are based on the recorded status of patients according to World Health Organization sources, with the category “alive” formed to include patients who were last reported as hospitalized or discharged. The age band 30–35 years is marked on each graph for reference.

