Figure 1.

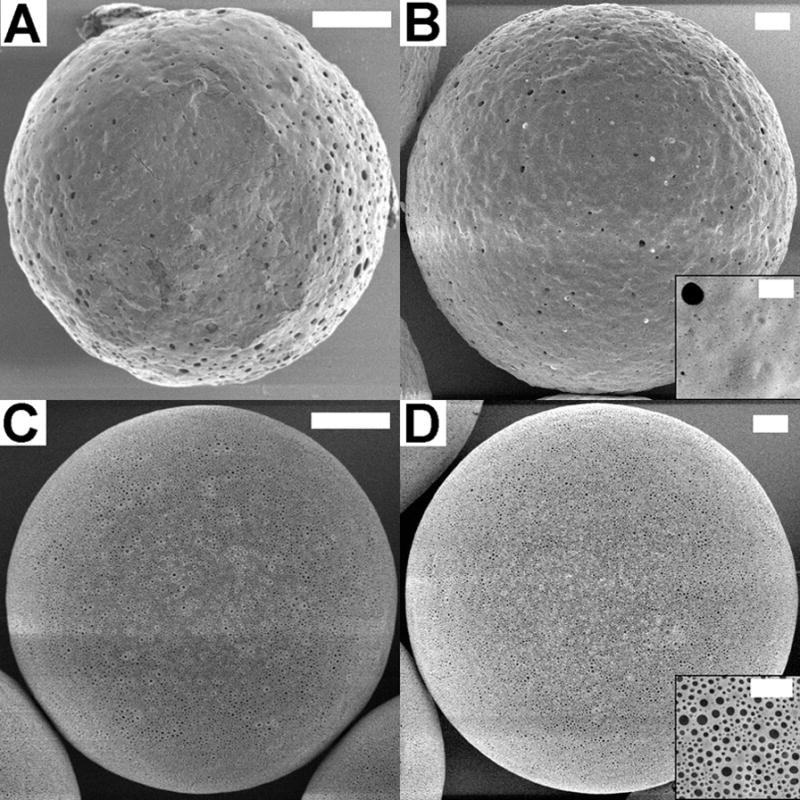
SEM images of microspheres prior to release. 47 μm non-Mg(OH)2 (A), 80 μm non-Mg(OH)2 (B), 47 μm with 3% Mg(OH)2 (C), and 80 μm with 3% Mg(OH)2 (D). Scale bar is 10 μm, 2 μm on inset.

SEM images of microspheres prior to release. 47 μm non-Mg(OH)2 (A), 80 μm non-Mg(OH)2 (B), 47 μm with 3% Mg(OH)2 (C), and 80 μm with 3% Mg(OH)2 (D). Scale bar is 10 μm, 2 μm on inset.