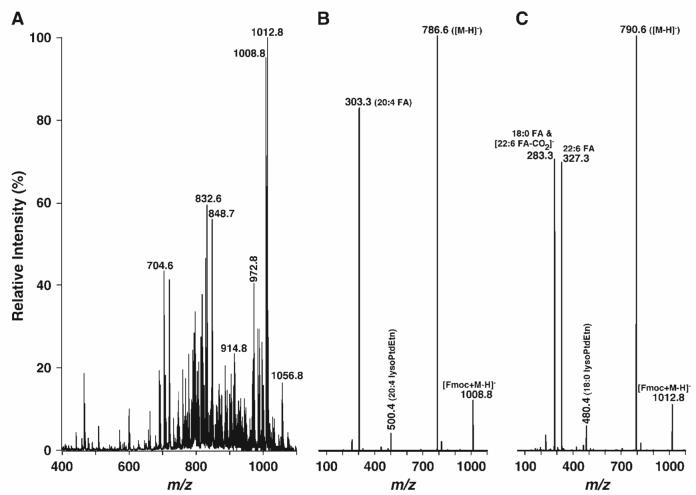
Fig. 3.
Representative negative ion ESI-MS and product ion ESI mass spectra of a lipid extract of mouse retinas after derivatization with fluorenylmethoxylcarbonyl chloride (Fmoc-Cl). An appropriate amount of Fmoc-Cl in anhydrous chloroform was added to the identical mouse retina lipid extract used in Fig. 1 in a ratio of 1:1 [Fmoc-Cl to ethanolamine glycerophospholipid (PE) content in the extract]. The mixture was incubated at room temperature for 5 min and diluted directly with 1:1 chloroform-methanol to a concentration of ∼50 pmol/μl total lipids. The negative ion ESI mass spectrum (A) was acquired as described in Materials and Methods. Product ion ESI-MS analyses of Fmoc-derivatized pseudomolecular ions at m/z 1008.8 (B) and 1012.8 (C) as shown in A were performed by selection of the pseudomolecular ion in the first quadrupole, collision activation in the second quadrupole with a collision energy of 30 eV and gas pressure of 1 mTorr, and analysis of the resulting product ions in the third quadrupole.

