
Figure 3.
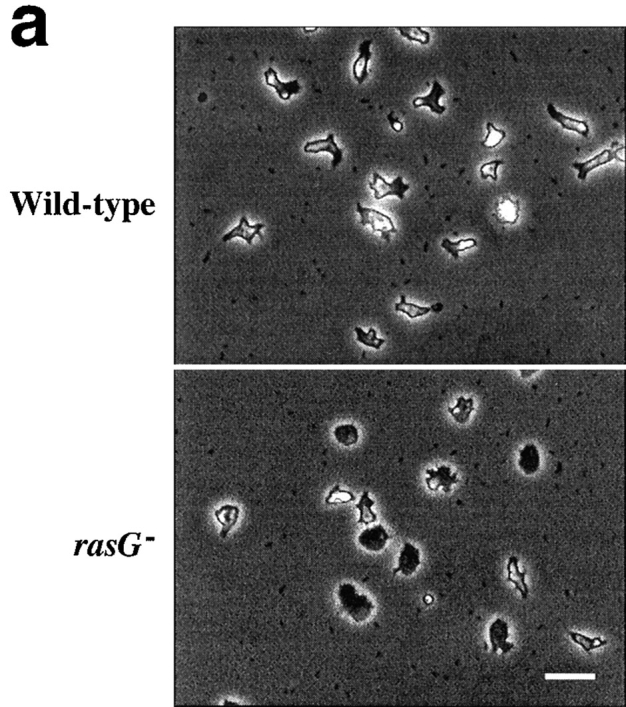


Morphology of wild-type and rasG − cells. (a) Phase-contrast micrographs of cells adhering to glass. Wild-type cells (top) show a rounded and polarized morphology, while rasG − cells (bottom) are more flattened and nonpolar. (b and c) Scanning confocal micrographs of cells stained with rhodamine–phalloidin to visualize F-actin. (b) Moving wild-type cells (top) and rasG − cells (bottom). (c) Stationary wild-type (top) and rasG − cells (bottom). Bar: (a) 20 μm; (b and c) 10 μm.