
Figure 5.
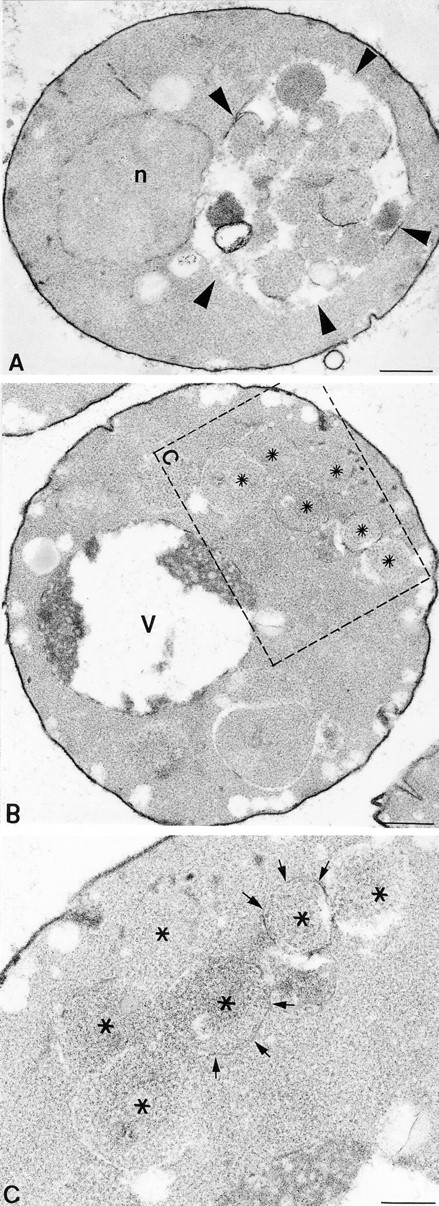
Examination of autophagy by EM. (A) Example of a pep4Δ cell (TDY10 harboring complementing VAM3 plasmid, pVAM3.414) after a 2.5-h induction of autophagy by nitrogen starvation at 38°C. (Arrowheads) The accumulation of autophagic bodies within the vacuole. (B) Cross-section of a vam3tsfpep4Δ cell (TDY10 cells harboring vam3tsf plasmid, pVAM3-6.414) after a 2.5-h induction of autophagy at a nonpermissive temperature of 38°C. An accumulation of autophagosomes in the cytoplasm (asterisks) is enclosed by the dashed box. (C) A region of the cell in B is enlarged in C, and arrows point to the membrane surrounding the autophagosomes. Fragments of the fragile limiting membrane are visible (arrows). n, nucleus; v, vacuole. Bars: (A and B) 500 nm; (C) 200 nm.