
Figure 8.
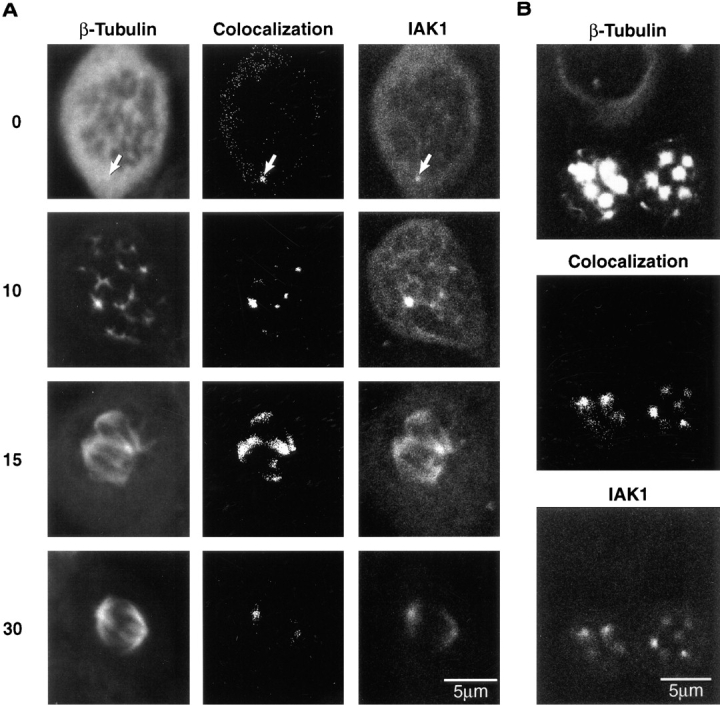
(A) Localization of IAK1 in nocodazole-treated cells. NIH 3T3 cells were treated with nocodazole (5 μg/ml) for 4 h, washed in fresh medium, and then fixed in ice-cold methanol at various times after release from nocodazole block. Cells were stained with a monoclonal anti–β-tubulin antibody or an anti-IAK1 antiserum followed by the appropriate secondary antibodies and visualized by laser scanning confocal microscopy as described in Materials and Methods. Shown are cells at time zero (0), 10 min after release from nocodazole (10), 15 min after release (15), and 30 min after release (30). Bar, 5 μm. (B) Localization of IAK1 in taxol-treated cells. NIH 3T3 cells were treated with taxol (10 μM) for 5 h and then fixed in ice-cold methanol. Cells were stained with antibodies as above for β-tubulin and IAK1. The two lower cells represent M-phase cells, while the upper cell is in interphase. Bar, 5 μm.