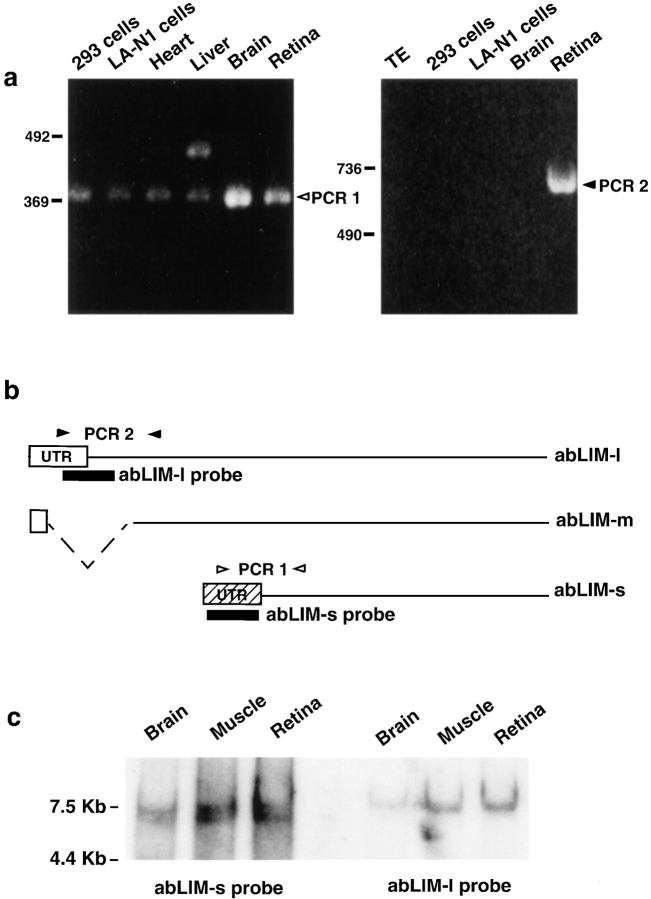
Figure 3.
Characterization of multiple abLIM transcripts. (a) Isoform-specific primer pairs were used in RT-PCR analysis of mRNA isolated from retina, brain, heart, liver, and two different cell lines, LA-N1 (Seeger et al., 1977) and 293 (Graham et al., 1977) cells. Primers that specifically amplify a sequence from abLIM-s (PCR 1) are indicated by open arrowheads in b. All tissues and cell lines tested gave the expected 369-bp PCR 1 product (a, open arrowhead, left), indicating the widespread presence of the abLIM-s transcript. A product of ∼450 bp was amplified from liver, suggesting that there may be additional abLIM isoforms or homologues in some tissues. Primers that specifically amplify a sequence from abLIM-l (PCR 2) are indicated by filled arrowheads in b. The appropriate 729-bp PCR 2 product is amplified only from retina (a, filled arrowhead, right). Exact primer sequences for PCR 1 and PCR 2 are given in Materials and Methods. (c) Northern blot of polyA+ RNAs (∼1 μg per lane) from human brain, skeletal muscle, and retina using probes unique to the abLIM-s or -l transcripts. Left three lanes were incubated with the probe specific for abLIM-s sequences (described in Materials and Methods). Right three lanes were probed with sequences present only in the abLIM-l isoform. Size markers are indicated to the left of each gel (bp). Primer sequences used to generate the probes are given in Materials and Methods. TE, Tris/EDTA buffer.

