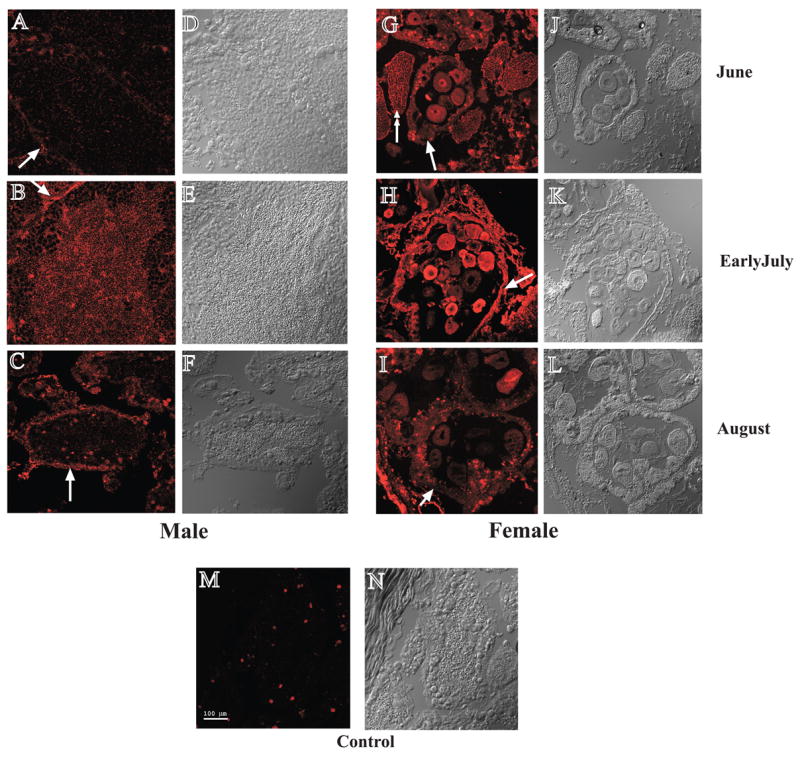
Figure 3. Spatial distribution of MCOX2 in male and female gonads.

(A-C) MCOX2 expression in male gonads at three time points. Note: distribution of MCOX2 changes from before to after fertilization period with its expression peaking just before fertilization (see Fig. 2 for fertilization timing). Images on the right (D-F) are the corresponding brightfield DIC images of the confocal immunofluorescence images on the left. (G-I) Spatial distribution of MCOX2 in female gonads, at three time points showing maximum expression of MCOX2 in the cytoplasm and nucleoplasm of eggs just prior to fertilization. Images on the right (J-L) are the corresponding brightfield DIC images of the confocal immunofluorescence images on the left. (M-N) Only relatively small, localized areas demonstrated immunoreactivity in male gonads using only secondary antibody. Bar (A-N) = 100 μm
