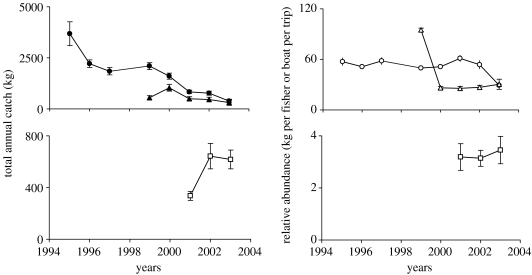
Figure 3.
Mean (±1 s.e.) total annual catches (kg) and relative abundance (kg per fisher or boat per trip) for all species lumped from three fish traders in northern Borneo: Kudat 1 (circles), Kudat 2 (triangles) and Malawali (squares). Filled symbols indicate a significant temporal change at α=0.05 level. Open symbols indicate non-significant tests. Malawali data (which are from a smaller fishery) are displayed separately for clarity.

