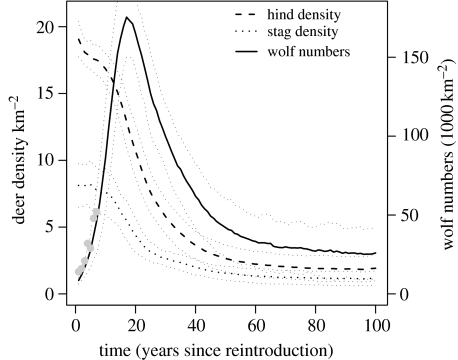
Figure 1.
Predicted transient dynamics following the introduction of wolves into Scotland. The dashed line represents hind (3 years or more) densities, the dotted line trophy stag (more than 5 years) densities, and the solid line wolf densities. Standard deviations (thin dotted lines) around the lines do not include cases when wolves went extinct. The grey points are wolf densities in the northern range of Yellowstone National Park following the wolf reintroduction in 1995 (from Smith et al. 2003).

