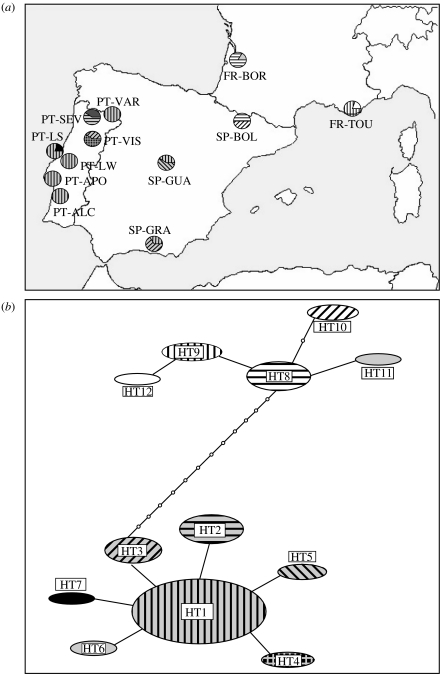
Figure 1.
Haplotype distribution and network of T. pityocampa COI sequences. (a) Geographical distribution of the haplotypes among the 12 sampled populations. PT-VAR: Varges; PT-SEV: Sevivas; PT-VIS: Viseu; PT-LS: Leiria SP; PT-LW; Leiria WP; PT-APO: Apostica; PT-ALC: Alcacer; SP-BOL: Boltaña; SP-GUA: Guadarrama; SP-GRA: Granada; FR-BOR: Bordeaux; FR-TOU: Toulon. (b) Haplotype network of the 12 haplotypes with the corresponding shaded codes. Haplotype frequencies are represented by the circle area. Each line corresponds to a mutational step and each empty circle to a missing intermediate haplotype.

