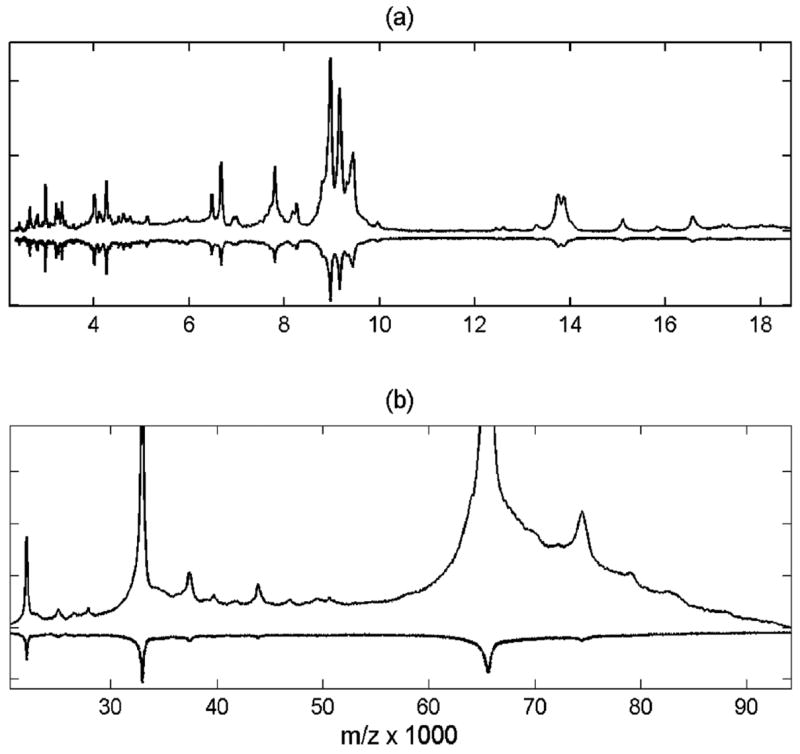
Figure 2.

Pooled serum spectrum was processed by integrative down-sampling and is shown in low (a) and high (b) mass range compared to raw data (inverted). Processed data is scaled to the same noise level as in the raw spectrum.

Pooled serum spectrum was processed by integrative down-sampling and is shown in low (a) and high (b) mass range compared to raw data (inverted). Processed data is scaled to the same noise level as in the raw spectrum.