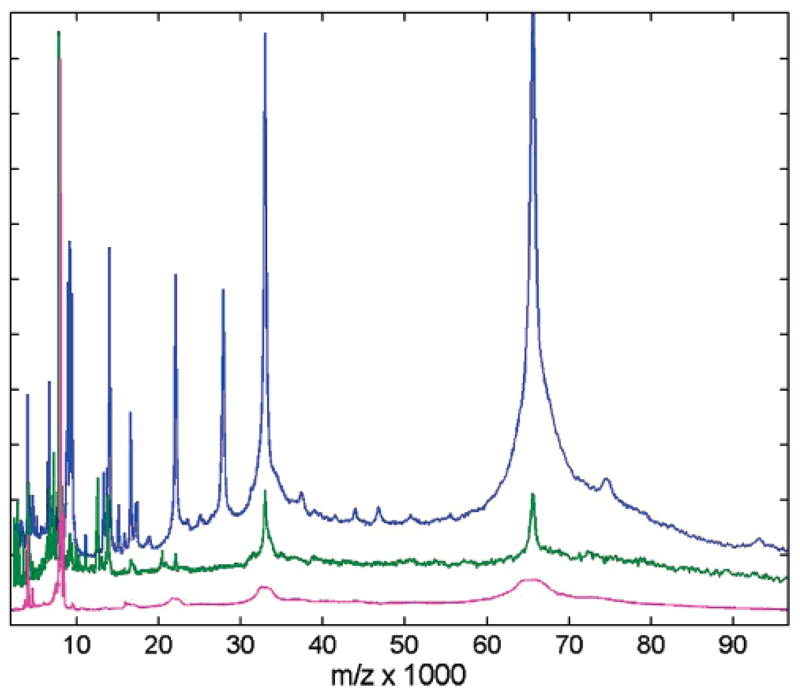
Figure 3.

Comparison of mass spectral content for three affinity capture magnetic bead surfaces using CHCA matrix: C8 (blue), WAX (green), Con A (magenta). Spectra are shown after integrative down-sampling, and are normalized to maximum intensity and vertically offset for clarity.
