
Figure 6.

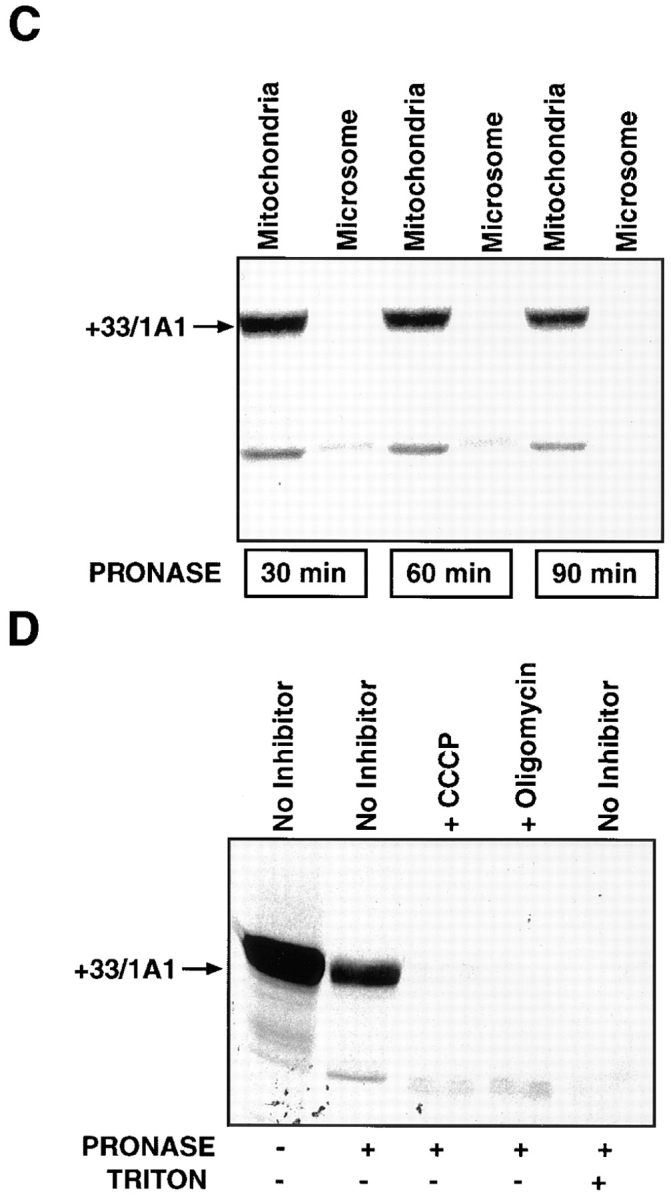
In vitro transport of P4501A1 into mitochondria. 35S-labeled in vitro translation products were programmed with the various cDNA constructs in a transcription-linked reticulocyte lysate system, and were used for in vitro transport in isolated rat liver mitochondria, as described in Materials and Methods. In each case, 200 μg of mitochondrial protein was used for electrophoresis, and the gels were subjected to fluorography. (A) 35S-labeled, full-length 1A1, +5/1A1, +33/1A1, +33/Mut, and 1A1Mut proteins were used for the in vitro transport. Faster migrating bands in some of the lanes probably represent proteolytic fragments generated as a result of endogenous mitochondrial or externally added protease action. A single + at the top of lanes represents treatment with 125 μg pronase, and ++ represents treatment with 250 μg pronase/ml of reaction. (B) In vitro transport of +33/1A1, +53/1A1, and +73/ 1A1 proteins into isolated rat liver mitochondria. Protease treatment was carried out using 125 μg of pronase/ml of reaction. (C) The specificity of the in vitro transport system was tested using 35S labeled +33/1A1 protein, as well as mitochondrial and microsomal fractions isolated from rat liver. Incubations with mitochondrial or microsomal membranes were carried out as described in A. Protease digestion was carried out for various time periods as indicated, using 125 μg pronase/ml of reaction. (D) Effects of mitochondrial inhibitors on the in vitro protein transport were tested using 35S-labeled +33/1A1 protein. The reaction mixtures were preincubated with or without added inhibitors (50 μM CCCP or 50 μM oligomycin) at 25°C for 10 min before initiating the in vitro transport by adding the 35S-labeled +33/1A1 translation product. Triton X-100 was added to the sample marked +Triton at a final concentration of 0.3% at the start of protease digestion. Protease digestion was carried out for 60 min with 125 μg pronase/ml of reaction. Radioactivity in −Pronase samples in the case of 1A1, +5/1A1, and +33/1A1 proteins represent ∼50–60% of the input counts, indicating efficient binding to mitochondria. The mutant proteins showed varied levels of binding as follows: +33/Mut = 10%, 1A1Mut and +73/1A1 = 30%, and +53/1A1 = 4% of input.