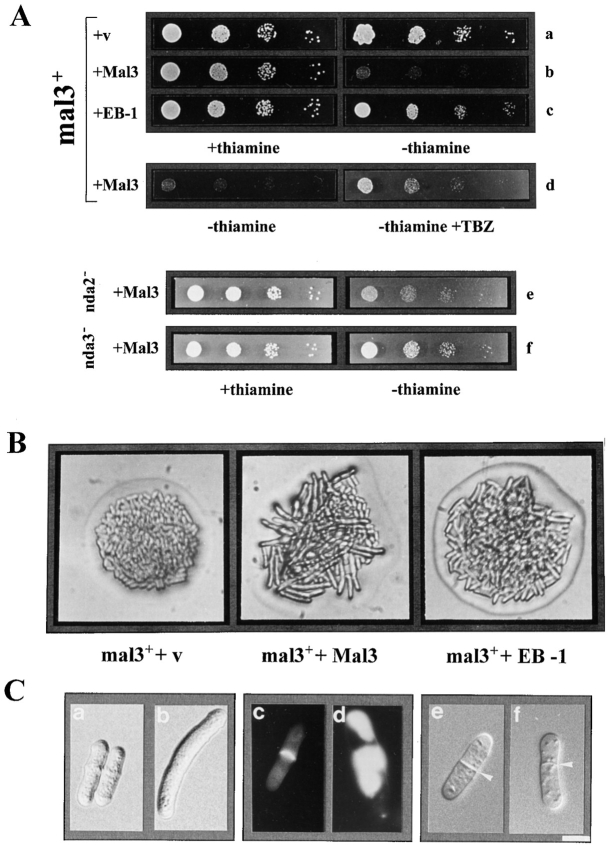
Figure 6.
Phenotypic characterization of overexpression of Mal3 and EB-1 proteins. (A) Serial dilution patch test for inhibition of colony formation by overproduction of Mal3 and EB-1. Dilutions shown were tenfold. A mal3 + strain was transformed with either the insert-less vector (a) or plasmids expressing mal3 + (b) or EB-1 (c) from the nmt1 + promoter. Strains were grown for 18 h at 30°C in thiamineless medium and then plated on EMM medium with (+) or without thiamine (−).The growth inhibition phenotype of Mal3 overexpression was suppressed by 10 μg/ml TBZ (d) or the presence of the α- and β-tubulin mutants, nda2-KM52 and nda3-KM311, respectively (e and f). Colonies were photographed after incubation for 3 d at 30 or 29°C (mutant tubulin strains). (B) Photomicrographs of colonies of wild-type cells transformed with vector control (v), or plasmids expressing mal3 + or EB-1. Strains were pregrown as in A before streaking cells on thiamineless plates and incubating them for 1.5 d at 30°C. (C) mal3 + was overexpressed in a wild-type strain for 0 (a, c, and e), 19 (f), 21 (b), or 24 (d) h at 30°C. c and d show staining of septa by calcofluor. Septa in e and f are indicated by arrowheads. Bar, 5 μm.

