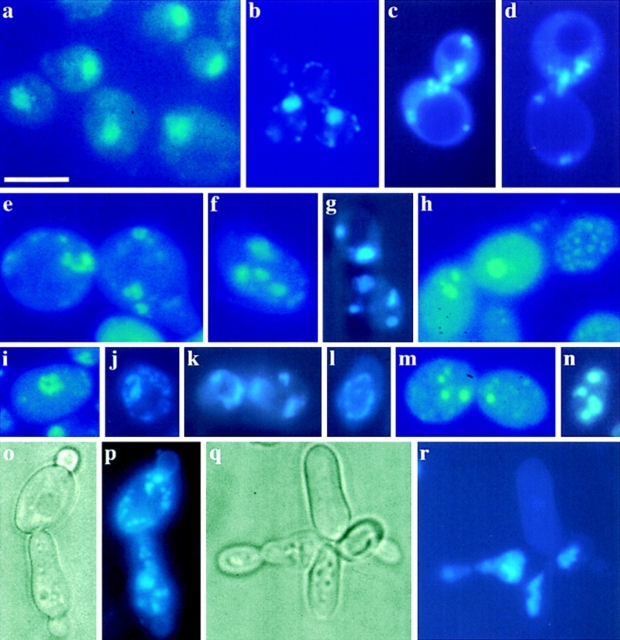
Figure 2.
Chromatin fragmentation. DAPI stain (c–n, p, and r) and phase contrast representation (o, and q) of KFY437 cells, and DAPI stain of KFY417 (a) and of cdc48 mutant rE24-15 (b) as controls. i–k were cells grown exponentially on YEP/glucose; a, c–h, and l–n are stationary cells from glucose medium, harvested 2 d after inoculation; o/p and q/r are stationary cells from glucose medium, harvested 5 d after inoculation; b shows exponentially growing cells of rE24-15 that were cell division cycle arrested by a 3-h incubation at 37°C. Bar, 10 μm.

