
Figure 2.

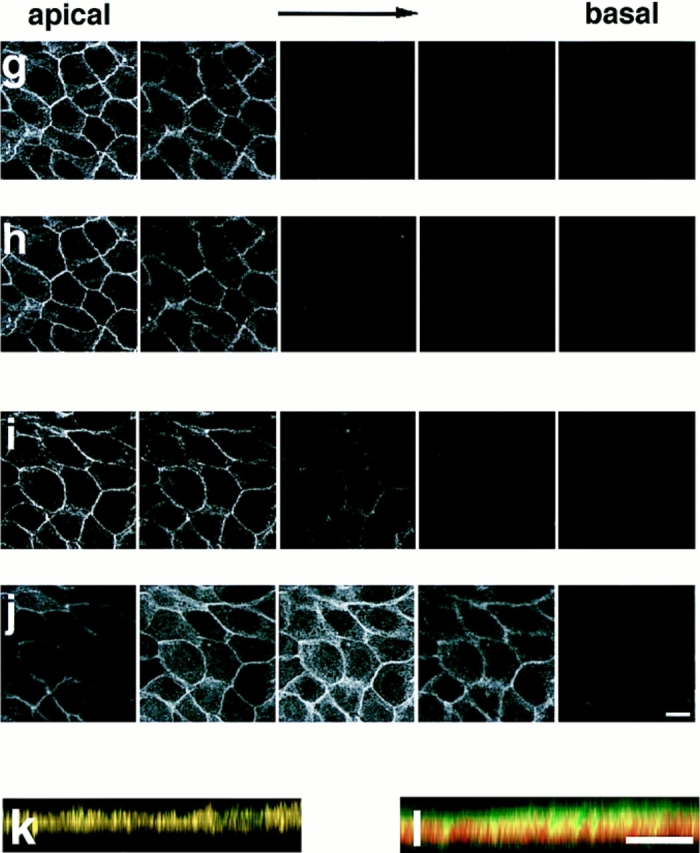
Confocal microscope images of confluent MDCKII cells showing the distributions of AF-6, ZO-1, and α-catenin. Confluent MDCKII cells were doubly stained with a rabbit polyclonal antibody against AF-6 and a mouse monoclonal antibody against ZO-1 (a–c, h, and k) or a rat monoclonal antibody against α-catenin (d–f, j, and l), followed by FITC-conjugated anti–rabbit IgG and Texas red-conjugated anti–mouse IgG or Texas red-conjugated anti–rat IgG antibodies. 20 serial optical sections were obtained at 0.8-μm intervals, and three-dimensional images were generated. In images a, c, d, f, k, and l, AF-6 is shown in green, and ZO-1 (b, c, and k) or α-catenin (e, f, and l) is shown in red. The yellow area indicates the colocalization of AF-6 and ZO-1 (c and k) or α-catenin (f and l). Images a–f are unrotated en face view. In images k and l, images c and f are rotated latitudinally by 90°, respectively. Images g–j show five confocal sections for each staining. Images g and i show the distribution of AF-6, and images h and j show that of ZO-1 and of α-catenin, respectively. Subsequent sections from apical to basal were shown from left to right. The results shown are representative of three independent experiments. Bars, 10 μm.