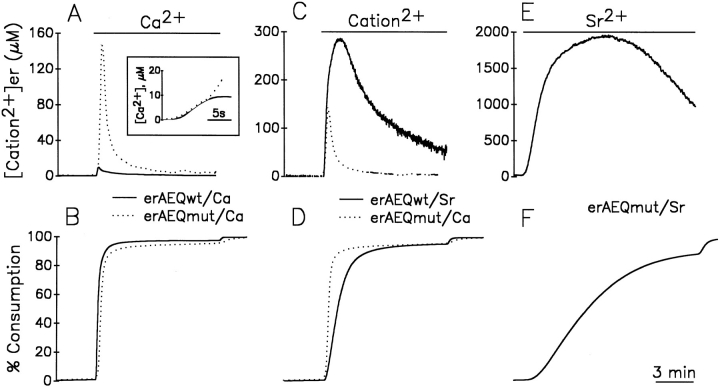
Figure 2.
Apparent kinetics of [cation2+]er during store refilling with Ca2+ and Sr2+ as measured in cells expressing erAEQmut and erAEQwt. (A and B) Continuous lines represent cells expressing erAEQwt. Dotted lines represent cells expressing erAEQmut. Where indicated, the perfusion medium contained 1 mM CaCl2. A shows the calibrated values of [Ca2+]er with both aequorins, with the inset illustrating the first seconds after Ca2+ addition at higher magnification. B shows the data of aequorin luminescence recalculated as an accumulative plot, considering the total amount of photons emitted during the whole experiment (normalized to 100%) and the percentage emitted as a function of time. In this plot it is immediately obvious the residual amount of aequorin available at any given time being compared with the calibrated values of [cation2+]er. (C and D) The erAEQmut-expressing HeLa cells (dotted lines) were challenged where indicated with 1mM Ca2+, whereas the erAEQwt-expressing cells (continuous lines) were challenged with 1 mM Sr2+. (E and F) The erAEQmut HeLa cells were perfused with 1 mM Sr2+ where indicated.

