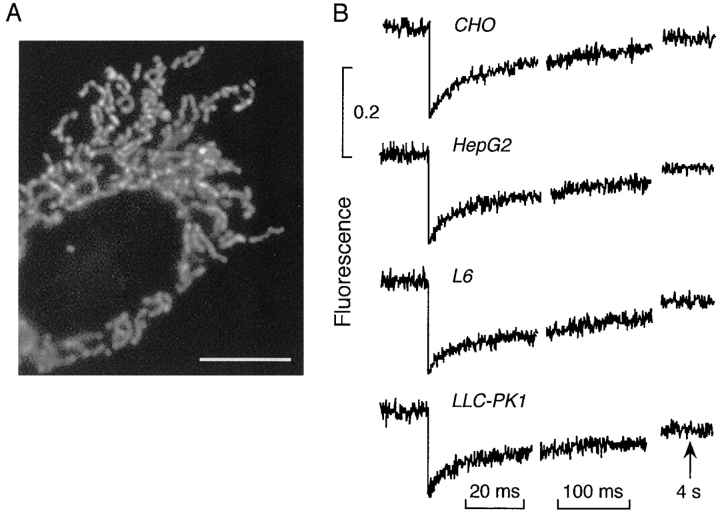
Figure 1.
Spot photobleaching of GFP in the mitochondrial matrix. (A) Confocal fluorescence micrograph of CHO cells expressing GFP in mitochondria (100× objective, NA 1.4). (B) Photobleaching of GFP in the mitochondrial matrix of indicated cells. Measurements were done using a 100× objective (0.8-μm-diam spot) and 40 μs bleach time at 23°C. Each curve is the average of 10–15 fluorescence recovery curves from different cells. Bar, 5 μm.

