
Figure 5.
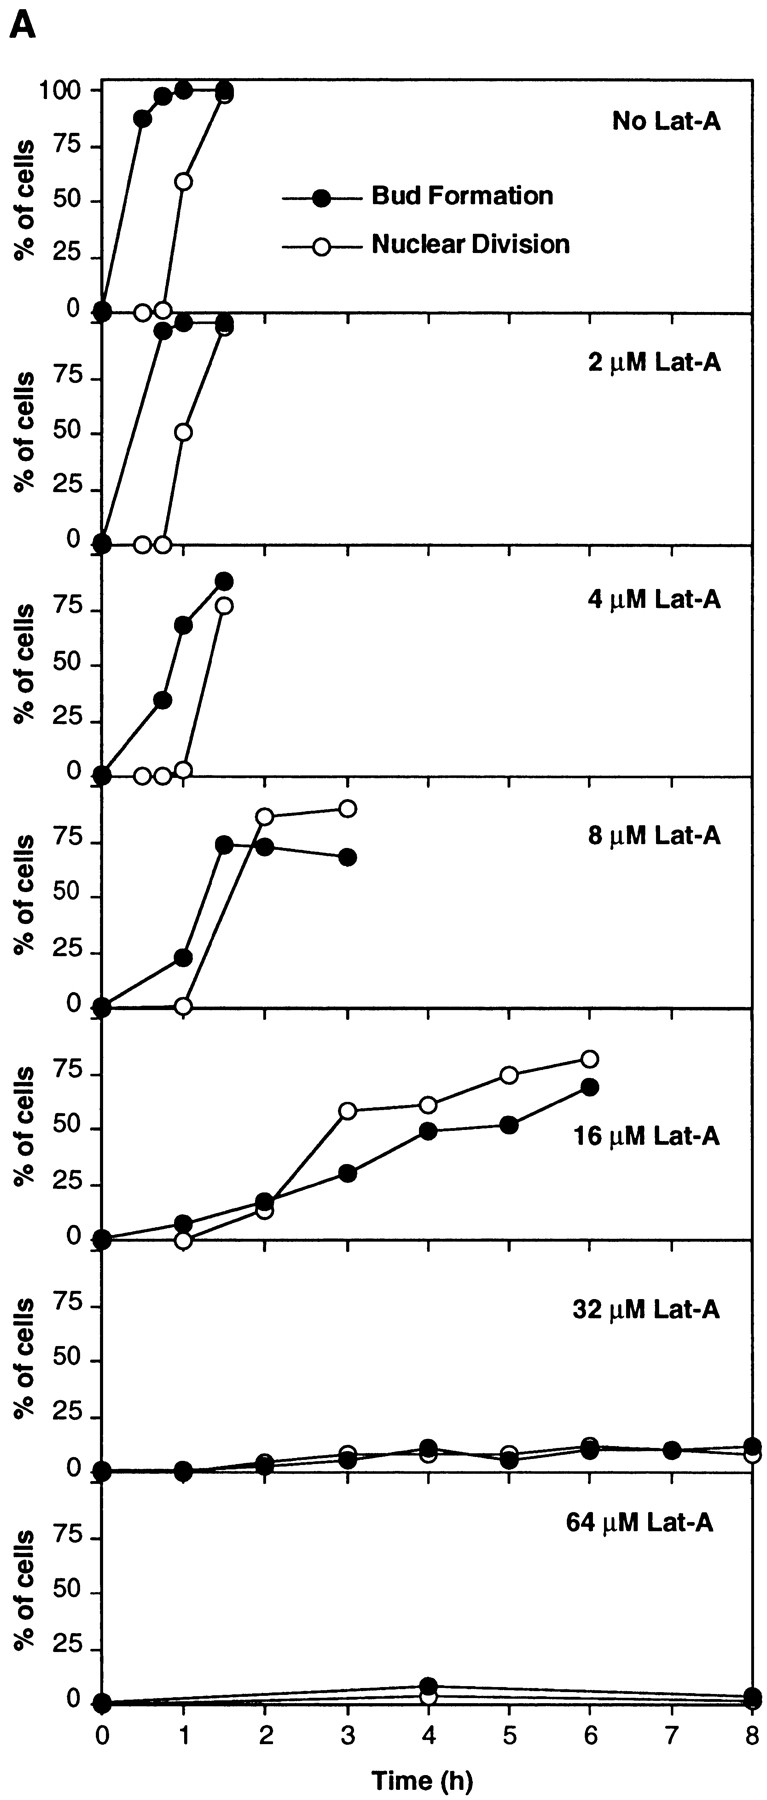

The checkpoint delay at low doses of Lat-A. (A) Kinetics of bud formation and nuclear division in wild-type cells (DLY1) after release from α-factor–induced G1 arrest into fresh media containing the indicated concentrations of Lat-A. (B) (Top) The data from A is replotted as the time taken for 50% of the cells to form buds (black bars) or undergo nuclear division (gray bars) at the indicated concentrations of Lat-A. The middle and bottom panels represent similar plots from identical experiments with swe1::LEU2 (DLY1028, middle) and mih1:LEU2 (JMY1292, bottom) strains.