
Figure 10.
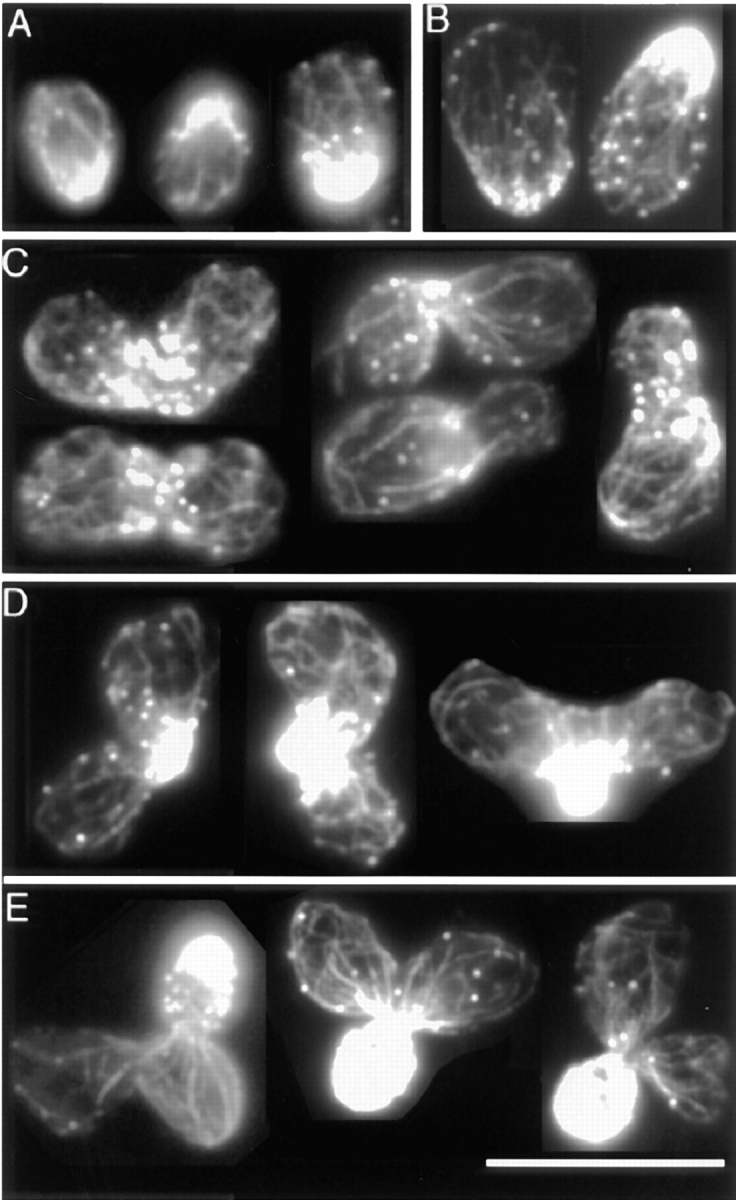
Cables in zygote formation and development. (A) Cells with mating projections after 1 h of α-factor treatment. (B) Cells with mating projections after 3 h of α-factor treatment. (C– E) Sequential stages of zygote formation and development. Single–focal plane images of cells stained with rhodamine-phalloidin are shown. Bar, 10 μm.