
Figure 12.
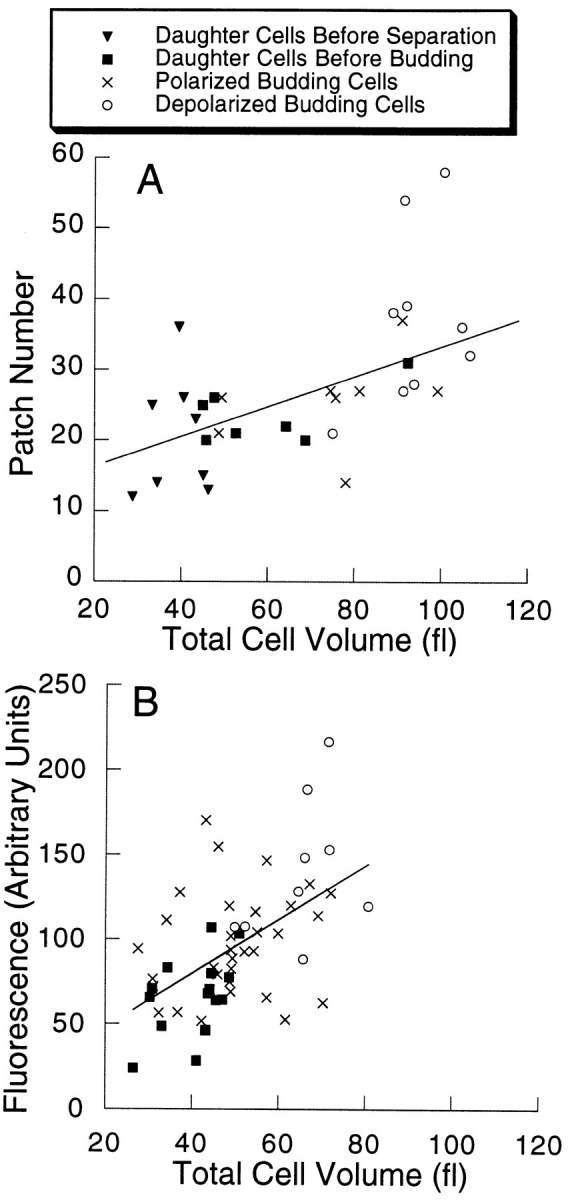
Patch number and filamentous actin level through the cell cycle. (A) Patch number is plotted vs. cell volume. (B) Filamentous actin (arbitrary units of fluorescence) is plotted vs. cell volume. Each point represents one cell. Cells at different stages of the cell cycle are indicated by different symbols, as shown in the figure. The lines were produced by a linear regression analysis of the data. For A, r = 0.61 and P ≤ 0.001, and for B, r = 0.54 and P = 0.001.