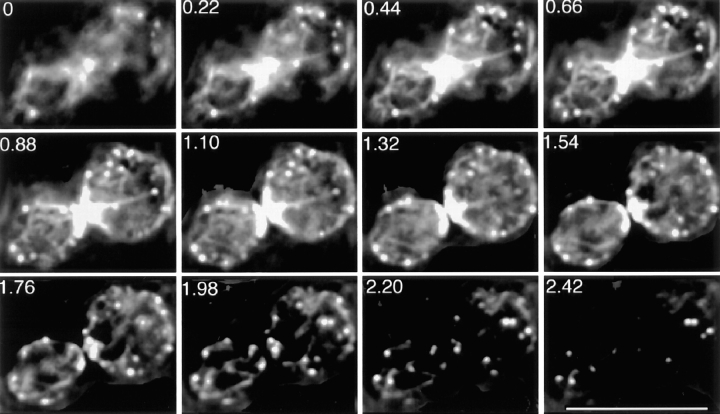
Figure 4.
Optical sectioning of a large-budded cell with a meshwork of thin cables. The distance (μm) of sequential planes along the z-axis is indicated. This cell is also shown as a stereopair in Fig. 3 D. The cell was stained with rhodamine-phalloidin. Deconvolution was with the PWLS method. Bar, 10 μm.

