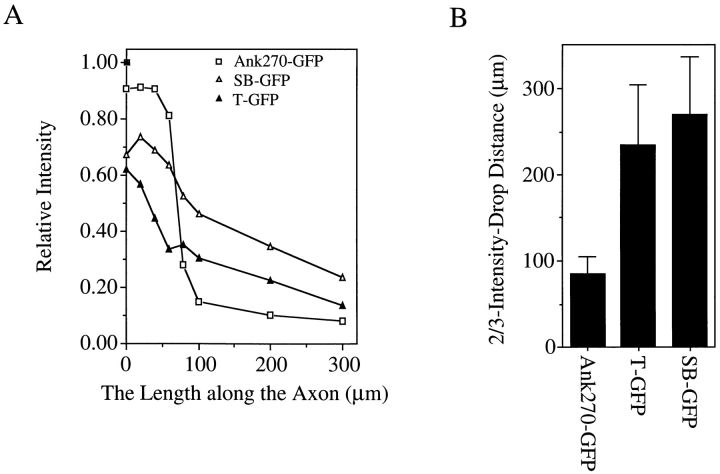
Figure 6.
The immunofluorescence intensity profile of transfected spectrin-binding and tail domains of ankyrinG in axons. (A) Immunofluorescence profile. (B) the two-thirds intensity-drop distance of transfected spectrin-binding and tail domains. Data represent the mean ± SEM for five transfected neurons.

