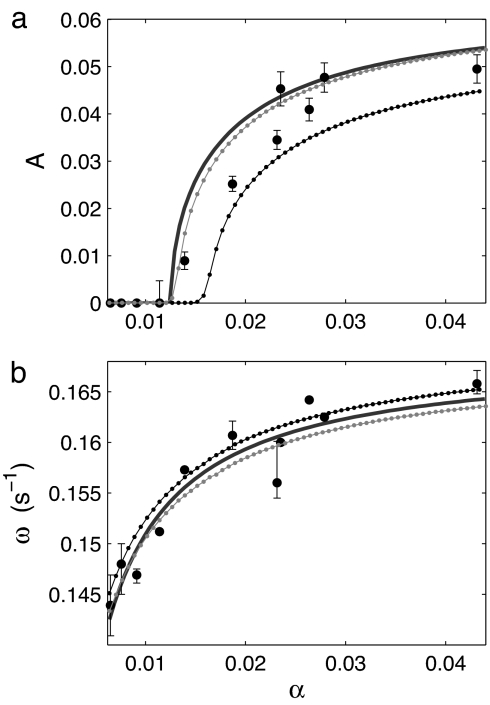
Fig. 5.
Numerical simulations of Eq. 1 for a population of n = 100 limit-cycle oscillators. The parameters are derived from the experimental data or chosen according to the hypothesis of time-scale separation and fast diffusion. Amplitude A (a) and frequency ω (b) are plotted against cell density. The experimental data of Figs. 2 and 3 (black circles) and the reduced system (solid line) are compared with simulations of a population of identical oscillators (gray dots) and of a population with a mismatch in the frequencies of the individual oscillators (Gaussian distribution with a relative standard deviation of 15%; black dots). The parameter values are ω0 = 0.17 s−1, λ0 = 0.015 s−1, τ = 0.16 s−1, g = −3.8 s−1, θ = 87°, λfast = −500 s−1, and daca = 300 s−1. See also Fig. 4 and Mathematical Model.

