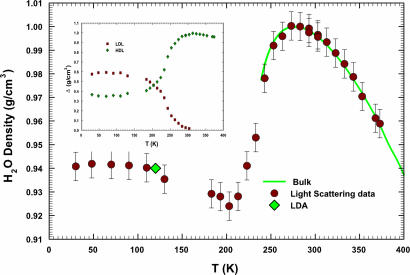
Fig. 2.
The temperature dependence of calculated ρH2O. The density values measured in pure bulk water in the range 239 < T < 423 K (32–34) are reported as a solid line. As one can see, a minimum is evident at TM = 203 ± 5 K. For T < TM density smoothly rounds off to the constant value ρ = 0.940 ± 0.003 g/cm3 in the LDA phase. Inside this latter phase, by means of the method of decompression and warming, the density has been measured at 120 K, obtaining a value ρLDA ≈ 0.94 g/cm3, plotted as a green diamond (31). (Inset) The contribution Δ of the HDL (green diamonds) phase and LDL (red squares) phase to H2O density as a function of temperature. The two Δ cross at ≈203 K. LDL and HDL are defined according to the LLPT hypothesis (6).

