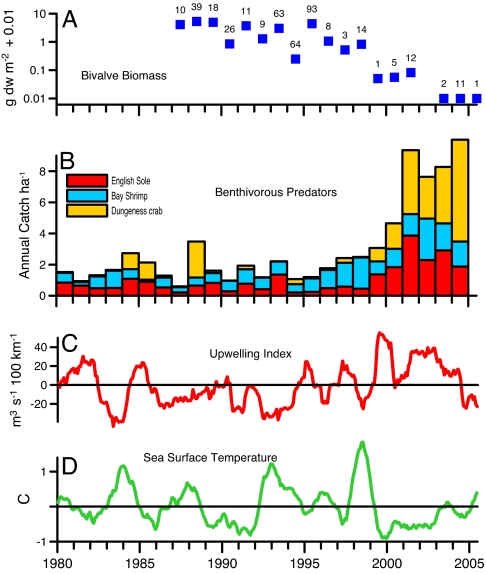
Fig. 3.
Indices of biological community change within SFB and physical changes in the adjacent California Current. (A) Annual median biomass of filter-feeding bivalves across shallow habitats in South SFB; numbers above squares indicate sample number per year. (B) Mean annual catch ha−1, normalized to 1980–2005 averages, of English sole, Bay shrimp, and Dungeness crab, from monthly sampling across the marine domains of SFB. (C) Anomalies in upwelling intensity computed by the National Oceanic and Atmospheric Administration from atmospheric pressure fields. (D) Sea surface temperature measured at the Farallon Islands. The bottom series (C and D) are 12-mo running averages of deviations from 1977–2005 monthly means.

