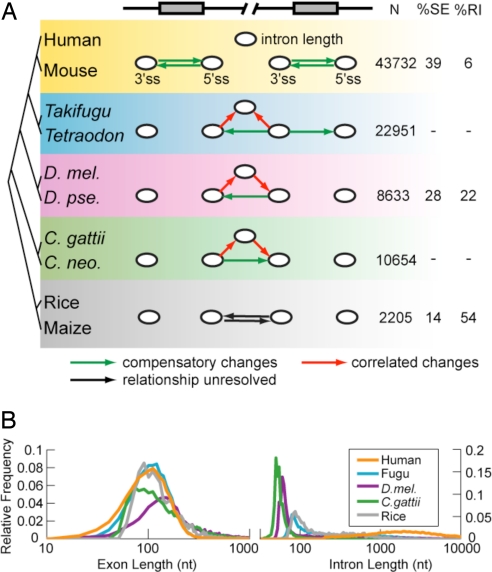
Fig. 2.
Coevolution of splice sites and introns in diverse eukaryotic taxa. (A) Using PVSA, the coevolution of five elements was modeled: the 3′ss and 5′ss of consecutive pairs of exons (all taxa) and intron length (all taxa except plants). An arrow from node X to node Y indicates significant covariation based on the PVS-X. Significant compensatory relationships are shown in green, correlated relationships are in red, and relationships with unresolved directionality are in black. The P value cutoff for all networks was 0.05 (allowing about one false positive network edge), except human–mouse, where a more stringent cutoff of P < 0.001 was used because the data were used in further network analyses (Fig. 3). The number of pairs of exons used (N), and the percentages of exon skipping and intron retention events among all alternative splicing events are also listed. (B) Semilog plot of exon and intron length distributions in five representative genomes. D. mel, Drosophila melanogaster; D. pse, D. pseudoobscura; C. gattii, Cryptococcus gattii; C. neo, C. neoformans; SE, skipped exon; RI, retained intron.

