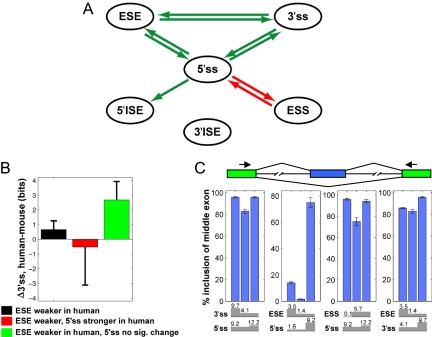
Fig. 3.
SRE coevolutionary network for human and mouse. (A) The network identified by using the PVSA method based on six classes of splicing cis elements is shown. For all edges P < 0.001. Arrows are colored as in Fig. 2. (B) Change in 3′ss strength (mean ± SE) for the set of PVS-ESE exons with weaker ESEs in human than mosue (black), and for subsets created by intersecting this set with the subset of the PVS-5′ss having weaker 5′ss in mouse (red) or the non-PVS-5′ss set (green). (C) Tests of bidirectional compensatory relationships detected in A used constructs containing combinations of stronger and weaker 5′ss, 3′ss, ESE, and ESS (with log-odds scores indicated) in the second exon. Inclusion of the second exon was assayed by body-labeled RT-PCR of total RNA from 293T cells transfected with each reporter by using primers targeted to the first and third exons. Blue bars indicate mean, and error bars indicate range of duplicated experiments.

