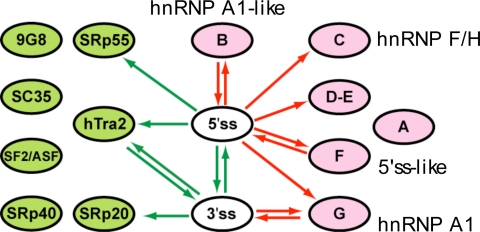
Fig. 4.
Evolutionary relationship among individual groups of ESE and ESS motifs. The splicing interaction network among ESE and ESS motifs resembling binding sites of SR proteins and hnRNPs is shown. All edges P < 0.001. Arrows are colored as in Fig. 2.

