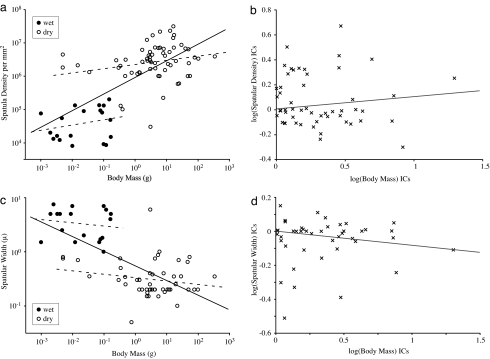
Fig. 2.
Linear regression on species values compared with independent contrasts (ICs). Solid lines represent regressions through the pooled dataset. Dashed lines represent partitioned (wet/dry) data. (a) Log–log plot of spatular density versus body mass for 81 taxa. (b) Phylogenetically corrected values for spatular density versus body mass. (c) Log–log plot of spatular width (μm) versus body mass (g) for 67 taxa. (d) Phylogenetically corrected values for spatular width versus body mass.

