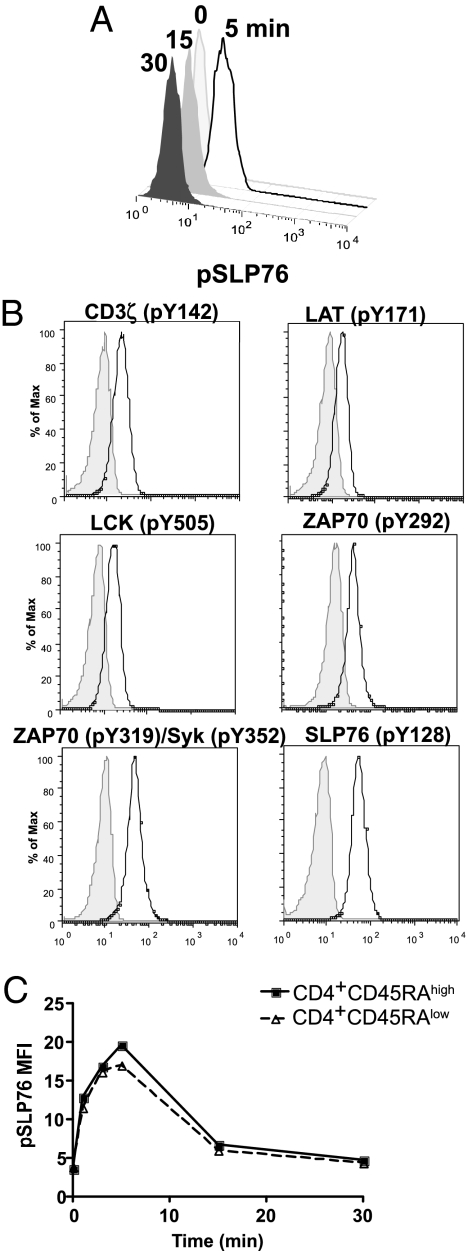
Fig. 3.
Time courses. (A) Histograms of raw flow-cytometric data gated on total CD4+ T cells. (B) Representative example of histograms showing the induction of phosphorylation with 10 μg/ml of soluble anti-CD3 at 5 min (shaded histogram, 0 min; open histogram, 5 min). (C) Representative example of a time course of pSLP76 phosphorylation. Mean values of three different healthy donors are shown.

