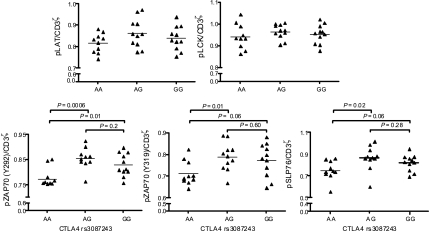
Fig. 6.
CTLA4 genotype-dependent phosphorylation pattern. Subjects with the AG and GG CTLA4 genotype at rs3087243 show different signaling patterns in CD4+CD45RAhigh and CD4+CD45RAlow T cells, compared with the AA genotype. Data were normalized to the pCD3ζ signal. Whole blood was stimulated for 5 min with 10 μg/ml soluble anti-CD3. Donor-specific baseline phosphorylation was accounted for. n(AA), 10; n(AG), 11; n(GG), 11.

