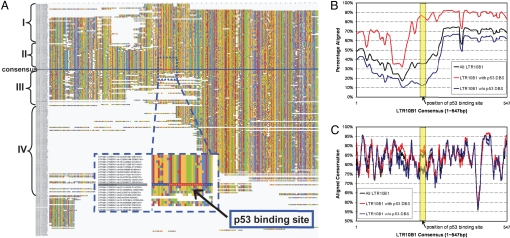
Fig. 3.
Evolutionary pattern of LTR10B1 genomic copies. Genomic copies of LTR10B1 are aligned to the consensus sequence. (A) Multiple sequence alignments, clustered based on existence of a p53 site and the percentage identity to the consensus. The blue line in the middle is the consensus sequence, and the red stretch indicates the position of the reconstructed p53 site. Every copy above the blue line contains a predicted p53 site. Sequences that are placed closer to the consensus have higher sequence similarity. The nucleotides are color-coded. A, green; C, yellow; G, red; T, blue. The image was created with Jalview (20). (B) Frequency of coverage of the consensus sequence by the genomic copies. (C) Average percentage identity of each base in the consensus sequence that is aligned to multiple genomic copies.

