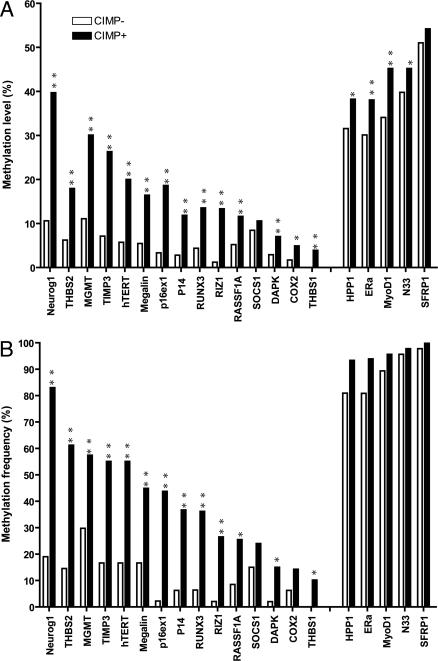
Fig. 1.
Comparison of methylation level and frequency for 20 genes between CIMP-positive and negative groups. (A) Comparison of the mean methylation level of each gene between CIMP-positive group and CIMP-negative group. All genes except SFRP1 and SOCS1 showed significantly higher methylation level in the CIMP-positive group. (B) Comparison of methylation frequency of positive cases for each gene between CIMP-positive and -negative groups. Methylation-positive case is defined by methylation level >15%. All Type-C genes except SOCS1 showed significantly higher frequency of methylation in CIMP-positive group, whereas 5 Type-A genes (on the Right) showed no difference between these two groups. **, P < 0.001; *, P < 0.05

