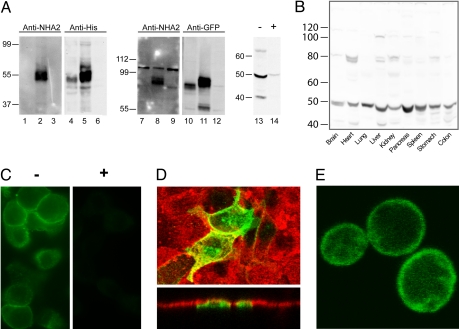
Fig. 2.
Distribution and subcellular localization of NHA2. (A) Western blot of membranes isolated from yeast AB11c expressing HsNHA1 (lanes 1, 4, 7, and 10), HsNHA2 (lanes 2, 5, 8, and 11), or neither (lanes 3, 6, 9, and 12). Antibodies raised against an N-terminal peptide of HsNHA2 recognizes a ≈55 kDa polypeptide in yeast membranes expressing HsNHA2 only (lanes 2 and 8) and not HsNHA1 (lanes 1 and 7). Control antibodies against epitope tags recognize both NHA proteins (anti-His, lanes 4 and 5; anti-GFP, lanes 10 and 11). Mouse pancreatic lysates were treated with anti-NHA2 antibody after preincubation in the absence (−, lane 13) or presence (+, lane 14) of antigenic peptide for 1 h. (B) Western blot, generated by using anti-NHA2 antibody, of lysates (100 μg) from the indicated mouse tissues. A prominent band of ≈50 kDa was observed in all tissues. (C) Immunofluorescence micrograph of rat pancreatic β cells INS-1 (832/13) generated by using anti-NHA2 antibody (−, Left) and peptide-blocked anti-NHA2 antibody (+, Right). (D Upper) Confocal fluorescence image of polarized MDCK cells treated with Rhodamine-labeled wheat germ agglutinin (red) and transfected with GFP-HsNHA2 (green). (Lower) Two cells expressing GFP fluorescence show apical localization in the z plane. (E) Confocal fluorescence image of B31 yeast expressing GFP-HsNHA2 at the cell surface.

