Fig. 2.
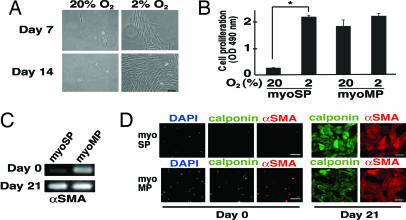
Hypoxic culture and smooth muscle cell differentiation of myoSP. (A) Phase-contrast images of myoSP cultured for 7 and 14 days under normoxic (20% O2) and hypoxic (2% O2) conditions. (Scale bar, 500 μm.) (B) Effects of hypoxia and normoxia on the proliferation of myoSP and myoMP as determined by the MTS assay. Each bar indicates the mean + SEM of the absorbance at 490 nm obtained from three independent experiments using three individual samples. *, P < 0.05. (C and D) Expression of αSMA mRNA (C) and smooth cell marker proteins (D) in myoSP and myoMP before (day 0) and after 21 days of hypoxic culture (day 21), as determined by RT-PCR (C) and immunofluorescence (D), respectively. (Scale bars, 50 μm.)

