Fig. 1.
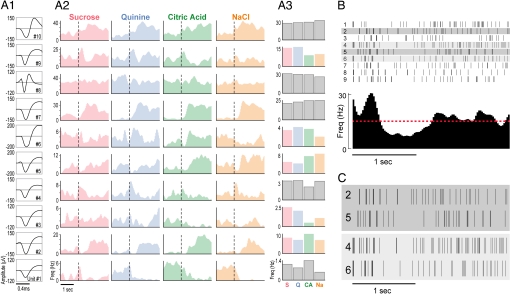
Taste responses in GC neurons. (A1) Waveforms representing the average action potential shapes for the 10 neurons (each numbered in bottom right) of one simultaneously recorded ensemble; x axis, time; y axis, amplitude (μV). (A2) PSTHs of the response of each neuron to the four basic taste stimuli (top); x axis, time; y axis, firing rate (Hz); dashed vertical line, stimulus onset. (A3) Responses of each neuron to the four tastes, averaged across trials and across 2.5 sec of poststimulus time; color panels are taste-specific by classic analysis (28). (B) (Upper) Raster plots of a neuron response on individual trials (rows). Each tick mark is an action potential. (Lower) Resultant PSTH; the red dashed line indicates the spontaneous firing rate. (C) Two pairs of trials from B, each matched for number of action potentials.

