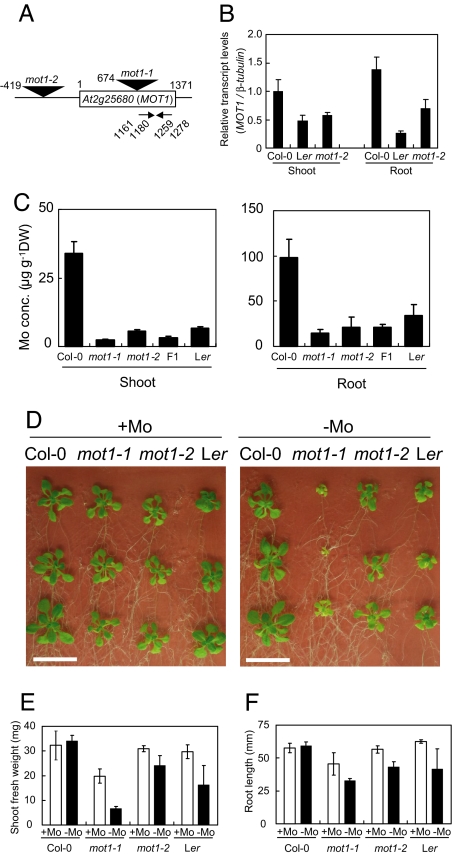
Fig. 2.
Characterization of T-DNA insertion mutants of A. thaliana. (A) Sites of T-DNA insertion and primers used for transcript amplification. The locations of the T-DNA insertions and positions of the left border are represented with triangles and numbers. For the nucleotide numbers, the A in the ATG translation initiation codon was designated as +1. The two primers contained sequences between the nucleotide numbers indicated were used for the determination of transcript accumulation. (B) Relative accumulation of the MOT1 transcript measured by using reverse-transcription-mediated quantitative real-time PCR. Plants were grown on a solid standard medium (20). The accumulation of the MOT1 transcript is expressed relative to that of the β-tubulin transcript. Averages and standard deviations are shown; n = 3. (C) Mo concentrations in roots and shoots. Plants were grown hydroponically for 5 weeks in the standard medium (20). Averages and standard deviations are shown; n = 5. (D) Effect of Mo deprivation on plant growth. Wild-type and mutant plants were grown for 18 days on vertically placed solid medium. Molybdate (170 nM) was added in +Mo medium and not in −Mo medium. (Scale bars: 2 cm.) (E) Growth of mot1 mutants. The seeds harvested from the plants grown on rockwool supplied with standard medium (20) without molybdate were used for this growth test. Plants were grown on solid standard medium with an added 14 mM KNO3 with and without 170 nM molybdate. The shoot fresh weights of plants grown for 15 days were measured, and averages and standard deviations are shown; n = 4. (F) The root length of plants grown for 8 days. Averages and standard deviations are shown; n = 4.

