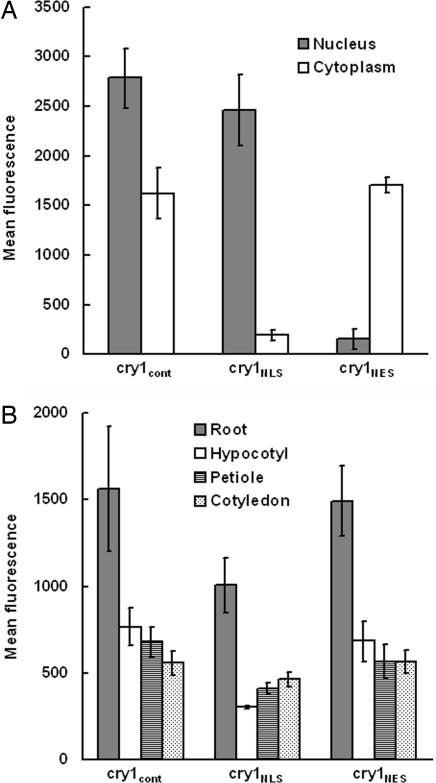
Fig. 2.
GFP-cry1 quantification in the transgenic seedlings. (A) Nuclear and cytoplasmic GFP-cry1 levels in root apices measured as fluorescence intensity by confocal microscopy. (B) Overall GFP-cry1 levels in the indicated organs in the three transgenic lines. The roots were imaged with a C-Apochromat ×40 objective lens so their fluorescence levels in B are not comparable to the other organs, which were imaged with a Plan-Aprochromat ×20 objective lens. Each measurement in A or B is the mean of measurements obtained from four to seven seedlings. Error bars represent standard errors.

