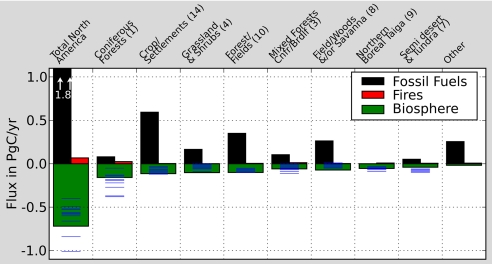
Fig. 2.
Annual mean flux per ecoregion within North America for the period 2001–2005 estimated from our system. Black bars are the prescribed fossil fuel fluxes, red bars are the prescribed fire fluxes, and green bars are the estimated biological fluxes. Units are PgC/yr for each ecoregion. Blue horizontal lines denote the range of values found in a set of sensitivity experiments conducted for the year 2001 to determine the uncertainty. The labels refer to ecosystem types according to ref. 16 (http://cdiac.ornl.gov/ftp/ndp017). See text for more details.

