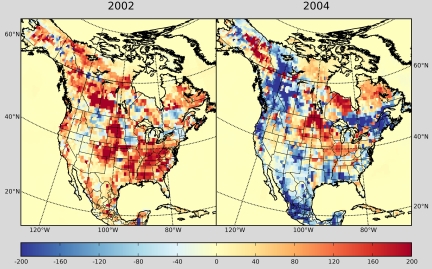
Fig. 3.
Net terrestrial summer flux (NEP plus fires for weeks 20–34) anomaly for the 2 extreme years of our estimate. 2002 had a strong positive summer flux anomaly due to droughts. In contrast, 2004 showed high uptake during the summer. The parameter estimates for 25 ecoregions have been projected to 1° × 1° to create this map. Units are gC/m2/yr.

